
Reason for changes in the
Explanation of Solution
The demand for ice cream will increase during the time of hot weather. When the demand for ice cream increases, it shifts its demand curve from left to right. The change in the demand curve of ice cream is shown in Figure-1 as follows:
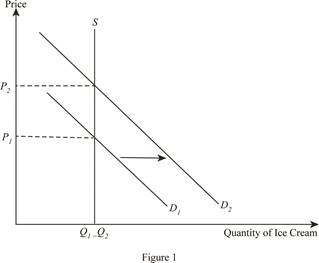
In Figure-1, the vertical axis measures the price of ice cream and the horizontal axis measures the quantity of ice cream. The vertical curve “S” shows the supply curve of ice cream in short run and downward sloping curve “D1” “D2” shows the shift in the demand curve. The initial
Demand curve: The demand curve shows the level of quantity demand at different price levels.
Want to see more full solutions like this?
Chapter 2 Solutions
Microeconomics (9th Edition) (Pearson Series in Economics)


 Economics (MindTap Course List)EconomicsISBN:9781337617383Author:Roger A. ArnoldPublisher:Cengage Learning