
Principles of Geotechnical Engineering (MindTap Course List)
9th Edition
ISBN: 9781305970939
Author: Braja M. Das, Khaled Sobhan
Publisher: Cengage Learning
expand_more
expand_more
format_list_bulleted
Concept explainers
Videos
Textbook Question
Chapter 2, Problem 2.12P
Repeat Problem 2.11 with the following data.
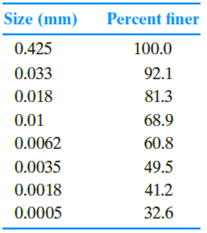
2.11 The grain-size characteristics of a soil are given in the following table.
a. Draw the grain-size distribution curve.
b. Determine the percentages of gravel, sand, silt, and clay according to the MIT system.
c. Repeat Part b using the USDA system.
d. Repeat Part b using the AASHTO system.
Expert Solution & Answer

Trending nowThis is a popular solution!

Students have asked these similar questions
5. The results of a particle size analysis of a soil are given in the following table. The Atterberg
limit tests yielded LL=62, PL = 20.
Sieve Opening (mm)
Percent Coarser by Weight
Sieve No.
4.75
5.1
10
2.00
10.0
20
0.85
0.425
40.7
40
70.2
84.8
90.5
60
0.25
100
0.15
200
Pan
0.075
100
a) Draw the gradation curve for this soil
b) Determine the uniformity coefficient and the coefficient of curvature
c) Classify the soil using USCS and ASSHTO
d) Rate this soil as a subgrade for highway construction
7. Following details regarding the particle size distribution and other index properties pertinent to the classification of soil. Choose three soils and classify
each soil according to USCS and AASHTO classification systems. When necessary, assume Cu = 4.48 and Cc = 1.22. Your solution may be presented in similar
form as what was included in your module 4.
Sieve Analysis (Percent Finer)
Soil No
Liquid Limit
Plastic Limit
No. 10
No. 40
No. 200
98
80
50
38
29
2
100
92
80
56
23
100
88
65
37
22
4
85
55
45
28
20
92
75
62
43
28
6
48
28
N.A.
NP
7
87
62
30
32
24
8
90
76
34
37
25
100
78
8
N.A.
NP
10
92
74
32
44
35
7. Following details regarding the particle size distribution and other index properties pertinent to the classification of soil. Choose three soils and classify
each soil according to USCS and AASHTO classification systems. When necessary, assume Cu = 4.48 and C = 1.22. Your solution may be presented in similar
form as what was included in your module 4.
Sieve Analysis (Percent Finer)
Soil No
Liquid Limit
Plastic Limit
No. 10
No. 40
No. 200
1
98
80
50
38
29
2
100
92
80
56
23
3
100
88
65
37
22
4
85
55
45
28
20
5
92
75
62
43
28
6
48
28
6
N.A.
NP
7
87
62
30
32
24
8
90
76
34
37
25
9
100
78
8
N.A.
NP
10
92
74
32
44
35
Chapter 2 Solutions
Principles of Geotechnical Engineering (MindTap Course List)
Ch. 2 - For a gravel with D60 = 0.48 mm, D30 = 0.25 mm,...Ch. 2 - Prob. 2.2PCh. 2 - Prob. 2.3PCh. 2 - The following are the results of a sieve analysis....Ch. 2 - Repeat Problem 2.4 with the following data. 2.4...Ch. 2 - Repeat Problem 2.4 with the following data. 2.4...Ch. 2 - Repeat Problem 2.4 with the following data. 2.4...Ch. 2 - The following are the results of a sieve and...Ch. 2 - Repeat Problem 2.8 using the following data. 2.8...Ch. 2 - Repeat Problem 2.8 using the following data. 2.8...
Ch. 2 - The grain-size characteristics of a soil are given...Ch. 2 - Repeat Problem 2.11 with the following data. 2.11...Ch. 2 - Repeat Problem 2.11 with the following data. 2.11...Ch. 2 - A hydrometer test has the following result: Gs =...Ch. 2 - Repeat Problem 2.14 with the following values: Gs...Ch. 2 - Three groups of students from the Geotechnical...Ch. 2 - Refer to Problem 2.C.1. Results of the sieve...
Knowledge Booster


Learn more about
Need a deep-dive on the concept behind this application? Look no further. Learn more about this topic, civil-engineering and related others by exploring similar questions and additional content below.Similar questions
- The grain-size characteristics of a soil are given in the following table. a. Draw the grain-size distribution curve. b. Determine the percentages of gravel, sand, silt, and clay according to the MIT system. c. Repeat Part b using the USDA system. d. Repeat Part b using the AASHTO system.arrow_forwardQ3 The results of a particle size analysis of a soil are given in the following Table. No Atterberg limit tests were conducted. Sieve No. Percent finer No.40 No.100 | No.200 49.8 No.4 No.10 No.20 70.2 62.5 9.53 mm 100 89.8 28.6 4.1 a) Would you have conducted Atterberg limit tests on this soil? Justify your answer. b) Classify the soil according to USCS and AASHTO. c) Is this soil a good foundation material? Justify your answerarrow_forwardThe following are the results of a sieve and hydrometer analysis. Analysis Sieve number/grain size Percent finer Sieve 40 100 80 97 170 92 200 90 Hydrometer 0.04 mm 74 0.015 mm 42 0.008 mm 27 0.004 mm 17 0.002 mm 11 a. Draw the grain-size distribution curve. b. Determine the percentages of gravel, sand, silt and clay according to the MIT system. c. Repeat Part b according to the USDA system. d. Repeat Part b according to the AASHTO system.arrow_forward
- Please answer this problem using the AASHTO system. NOT the MIT system. Thank you! The particle characteristics of a soil are given below. Draw the particle-size distribution curve and find the percentages of gravel, sand, silt, and clay Size (mm) Percent Finer 0.850 100.0 0.425 92.1 0.250 85.8 0.150 77.3 0.075 62.0 0.040 50.8 0.020 41.0 0.010 34.3 29.0 0.006 0.002 23.0arrow_forwardThe results of particle size analyses and, where appropriate, limit tests on samples of four soils are given in Table Q1. Allot group symbols and give main and qualifying terms appropriate for each soil. Table Q1 Percentage smaller Sieve Particle size size Soil A Soil B Soil C Soil D 20mm 100 6.3mm 94 100 2mm 69 98 600µm 32 88 100 212µm 13 67 95 100 63 μη 2 37 73 99 0.020mm 22 46 88 0.006mm 11 25 71 0.002mm 4 13 58 Liquid limit Non-plastic 32 78 Plastic limit 24 31 a) Draw the particle size distribution curve for four samples. b) Determine the coefficients of uniformity and curvature for soil A and B. c) Allot group symbols and give main and qualifying terms appropriate for soil A. d) Allot group symbols and give main and qualifying terms appropriate for soil B. e) Allot group symbols and give main and qualifying terms appropriate for soil C. f) Allot group symbols and give main and qualifying terms appropriate for soil D.arrow_forwardRepeat Problem 2.8 using the following data. 2.8 The following are the results of a sieve and hydrometer analysis. a. Draw the grain-size distribution curve. b. Determine the percentages of gravel, sand, silt and clay according to the MIT system. c. Repeat Part b according to the USDA system. d. Repeat Part b according to the AASHTO system.arrow_forward
- The particle characteristics of a soil are given below. Draw the particle-size distribution curve and find the percentages of gravel, sand, silt, and clay according to the MIT system (Table 2.3).arrow_forwardRedo Problem 2.7 according to the USDA system (Table 2.3). 2.7 The particle characteristics of a soil are given below. Draw the particle-size distribution curve and find the percentages of gravel, sand, silt, and clay according to the MIT system (Table 2.3).arrow_forwardRepeat Problem 2.4 with the following data. 2.4 The following are the results of a sieve analysis. a. Determine the percent finer than each sieve and plot a grain-size distribution curve. b. Determine D10, D30, and D60 for each soil. c. Calculate the uniformity coefficient Cu. d. Calculate the coefficient of gradation Cc.arrow_forward
- The particle size characteristics of a soil are given in the table. Using USDA method, determine: Size (mm) Percent Finer 4.75 98 0.85 95 0.044 36 0.033 32 0.0062 19 0.0025 9. 0.0011 1. Percentage of gravel (in 4 decimal places) 2. Percentage of sand (in 4 decimal places) 3. Percentage of silt (in 4 decimal places) 4. Percentage of clay (in 4 decimal places)arrow_forwardQuestion 40 The given data shows a sieve analysis of a soil sample. Classify the soil using AASHTO Method. Tables are provided below. Sieve No. Diameter (mm) Percent Passing No. 4 4.760 96 No. 8 2.380 80 No. 10 2.000 78 No. 20 0.840 61 No. 40 0.420 56 No. 60 0.250 48 No. 100 0.150 39 No. 200 0.075 33 Characteristics of No. 40 Fraction LL 45 PL 36arrow_forwardQ1 The results of particle size analyses and, where appropriate, limit tests on samples of four soils are given in Table Q1. Allot group symbols and give main and qualifying terms appropriate for each soil. Table Q1 Sieve Particle Percentage smaller size size Soil A Soil B Soil C Soil D 20mm 100 6.3mm 94 100 2mm 69 98 600μη 32 88 100 212µm 13 67 95 100 63 μη 37 73 99 0.020mm 22 46 88 0.006mm 11 25 71 0.002mm 4 13 58 Liquid limit Non-plastic 32 78 Plastic limit 24 31 d) Allot group symbols and give main and qualifying terms appropriate for soil B. e) Allot group symbols and give main and qualifying terms appropriate for soil C. f) Allot group symbols and give main and qualifying terms appropriate for soil D.arrow_forward
arrow_back_ios
SEE MORE QUESTIONS
arrow_forward_ios
Recommended textbooks for you
 Principles of Geotechnical Engineering (MindTap C...Civil EngineeringISBN:9781305970939Author:Braja M. Das, Khaled SobhanPublisher:Cengage Learning
 Fundamentals of Geotechnical Engineering (MindTap...Civil EngineeringISBN:9781305635180Author:Braja M. Das, Nagaratnam SivakuganPublisher:Cengage Learning
Principles of Geotechnical Engineering (MindTap C...
Civil Engineering
ISBN:9781305970939
Author:Braja M. Das, Khaled Sobhan
Publisher:Cengage Learning
Fundamentals of Geotechnical Engineering (MindTap...
Civil Engineering
ISBN:9781305635180
Author:Braja M. Das, Nagaratnam Sivakugan
Publisher:Cengage Learning
How Are Highways Designed?; Author: Practical Engineering;https://www.youtube.com/watch?v=9XIjqdk69O4;License: Standard Youtube License