
Videos
Capital rationing decision for a service company involving four proposals
Clearcast Communications Inc. is considering allocating a limited amount of capital investment funds among four proposals. The amount of proposed investment, estimated income from operations, and net cash flow for each proposal are as follows:
| Investment | Year | Income from Operations | Net Cash Flow | |
| Proposal A: | $450,000 | 1 | $ 30,000 | $120,000 |
| 2 | 30,000 | 120,000 | ||
| 3 | 20,000 | 110,000 | ||
| 4 | 10,000 | 100,000 | ||
| 5 | (30,000) | 60,000 | ||
| $ 60,000 | $510,000 | |||
| Proposal B: | $200,000 | 1 | $ 60,000 | $100,000 |
| 2 | 40,000 | 80,000 | ||
| 3 | 20,000 | 60,000 | ||
| 4 | (10,000) | 30,000 | ||
| 5 | (20,000) | 20,000 | ||
| $ 90,000 | $290,000 | |||
| Proposal C: | $320,000 | 1 | $ 36,000 | $100,000 |
| 2 | 26,000 | 90,000 | ||
| 3 | 26,000 | 90,000 | ||
| 4 | 16,000 | 80,000 | ||
| 5 | 16,000 | 80,000 | ||
| $120,000 | $440,000 | |||
| Proposal D: | $540,000 | 1 | $ 92,000 | $200,000 |
| 2 | 72,000 | 180,000 | ||
| 3 | 52,000 | 160,000 | ||
| 4 | 12,000 | 120,000 | ||
| 5 | (8,000) | 100,000 | ||
| $220,000 | $760,000 |
The company’s capital rationing policy requires a maximum cash payback period of three years. In addition, a minimum average
Instructions
- 1. Compute the cash payback period for each of the four proposals.
- 2. Giving effect to straight-line depreciation on the investments and assuming no estimated residual value, compute the average rate of return for each of the four proposals. Round to one decimal place.
- 3. Using the following format, summarize the results of your computations in parts (1) and (2). By placing the calculated amounts in the first two columns on the left and by placing a check mark in the appropriate column to the right, indicate which proposals should lie accepted for further analysis and which should be rejected.
| Proposal | Cash Payback Period | Average Rate of Return |
Accept for Further Analysis | Reject |
| A | ||||
| E | ||||
| C | ||||
| D |
4. For the proposals accepted for further analysis in part (3), compute the net present value. Use a rate of 12% and the present value of $1 table appearing in this chapter (Exhibit 2).
5. Compute the present value index for each of the proposals in part (4). Round to two decimal places.
6. Rank the proposals from most attractive to least attractive, based on the present values of net cash flows computed in part (4).
7. Rank the proposals from most attractive to least attractive, based on the present value indexes computed in part (5).
8. Based on the analyses, comment on the relative attractiveness of the proposals ranked in parts (6) and (7).
1.
Cash payback method:
Cash payback period is the expected time period which is required to recover the cost of investment. It is one of the capital investment method used by the management to evaluate the long-term investment (fixed assets) of the business.
Average rate of return method:
Average rate of return is the amount of income which is earned over the life of the investment. It is used to measure the average income as a percent of the average investment of the business, and it is also known as the accounting rate of return.
The average rate of return is computed as follows:
Net present value method:
Net present value method is the method which is used to compare the initial cash outflow of investment with the present value of its cash inflows. In the net present value, the interest rate is desired by the business based on the net income from the investment, and it is also called as the discounted cash flow method.
Present value index:
Present value index is a technique, which is used to rank the proposals of the business. It is used by the management when the business has more investment proposals, and limited fund.
The present value index is computed as follows:
To determine: The cash payback period for the given proposals.
Explanation of Solution
The cash payback period for the given proposals is as follows:
Proposal A:
Initial investment=$450,000
| Cash payback period of Proposal A | ||||
| Year | Net cash flows | Cumulative net cash flows | ||
| 1 | 120,000 | 120,000 | ||
| 2 | 120,000 | 240,000 | ||
| 3 | 110,000 | 350,000 | ||
| 4 | 100,000 | 450,000 | ||
Table (1)
Hence, the cash payback period of proposal A is 4 years.
Proposal B:
Initial investment=$200,000
| Cash payback period of Proposal B | ||||
| Year | Net cash flows | Cumulative net cash flows | ||
| 1 | 100,000 | 100,000 | ||
| 2 | 80,000 | 180,000 | ||
| 4 months (1) | 20,000 | 200,000 | ||
Table (2)
Hence, the cash payback period of proposal B is 2 years and 4 months.
Working note:
1. Calculate the no. of months in the cash payback period:
Proposal C:
Initial investment=$320,000
| Cash payback period of Proposal C | ||||
| Year | Net cash flows | Cumulative net cash flows | ||
| 1 | 100,000 | 100,000 | ||
| 2 | 90,000 | 190,000 | ||
| 3 | 90,000 | 280,000 | ||
| 6 months (2) | 40,000 | 320,000 | ||
Table (3)
Hence, the cash payback period of proposal C is 3 years and 6 months.
Working note:
2. Calculate the no. of months in the cash payback period:
Proposal D:
Initial investment=$540,000
| Cash payback period of Proposal D | ||||
| Year | Net cash flows | Cumulative net cash flows | ||
| 1 | 200,000 | 200,000 | ||
| 2 | 180,000 | 380,000 | ||
| 3 | 160,000 | 540,000 | ||
Table (4)
Hence, the cash payback period of proposal D is 3 years.
2.
Explanation of Solution
The average rate of return for the given proposals is as follows:
Proposal A:
Hence, the average rate of return for Proposal A is 5.3%.
Proposal B:
Hence, the average rate of return for Proposal B is 18.0%.
Proposal C:
Hence, the average rate of return for Proposal C is 15.0%.
Proposal D:
Hence, the average rate of return for Proposal D is 16.3%.
3.
To indicate: The proposals which should be accepted for further analysis, and which should be rejected.
Explanation of Solution
The proposals which should be accepted for further analysis, and which should be rejected is as follows:
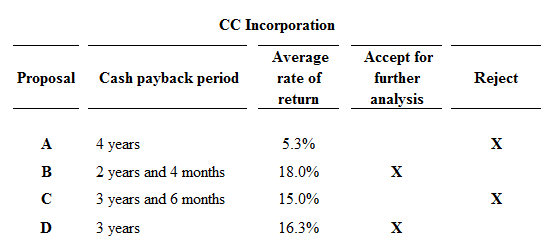
Figure (1)
Proposals A and C are rejected, because proposal A and C fails to meet the required maximum cash back period of 3 years, and they has less rate of return than the other proposals. Hence, Proposals B and D are preferable.
4.
Explanation of Solution
Calculate the net present value of the proposals which has 12% rate of return as follows:
Proposal B:
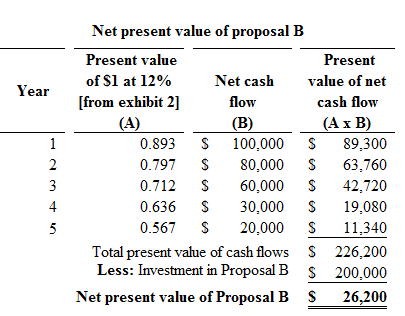
Figure (2)
Hence, the net present value of proposal B is $26,200.
Proposal D:

Figure (3)
Hence, the net present value of proposal D is $29,000.
5.
To determine: The present value index for each proposal.
Explanation of Solution
The present value index for each proposal is as follows:
Proposal B:
Calculate the present value index for proposal B:
Hence, the present value index for proposal B is 1.13.
Proposal D:
Calculate the present value index for proposal D:
Hence, the present value index for proposal D is 1.05.
6.
To rank: The proposal from most attractive to least attractive, based on the present value of net cash flows.
Explanation of Solution
Proposals are arranged by rank is as follows:
| Proposals | Net present value | Rank |
| Proposal D | $ 29,000 | 1 |
| Proposal B | $ 26,200 | 2 |
Table (5)
7.
To rank: The proposal from most attractive to least attractive, based on the present value of index.
Explanation of Solution
Proposals are arranged by rank is as follows:
| Proposals | Present value index | Rank |
| Proposal B | 1.13 | 1 |
| Proposal D | 1.05 | 2 |
Table (6)
8.
To analysis: The proposal which is favor to investment, and comment on the relative attractiveness of the proposals based on the rank.
Explanation of Solution
On the basis of net present value:
The net present value of Proposal B is $26,200, and Proposal D is $29,000. In this case, the net present value of proposal D is more than the net present value of proposal B. Hence, investment in Proposal D is preferable.
On the basis of present value index:
The present value index of Proposal B is 1.13, and the present value index of Proposal D is 1.05. In this case, Proposal B has the favorable present value index, because the present value index of Proposal B (1.13) is more than Proposal D (1.05). Thus, the investment in Proposal B is preferable (favorable).
Every business tries to get maximum profit with minimum investment. Hence, the cost of investment in Proposal B is less than the proposal D. Thus, investment in Proposal B is preferable.
Want to see more full solutions like this?
Chapter 26 Solutions
Accounting


- Capital rationing decision involving four proposals Kopecky Industries Inc. is considering allocating a limited amount of capital investment funds among four proposals. The amount of proposed investment, estimated income from operations, and net cash flow for each proposal are as follows: The company’s capital rationing policy requires a maximum cash payback period of three years. In addition, a minimum average rate of return of 12% is required on allprojects. 1f the preceding standards are met, the net present value method and presentvalue indexes are used to rank the remaining proposals. Instructions Compute the present value index for each oldie proposals in part (4). Round to two decimal places.arrow_forwardCash payback period for a service company Janes Clothing Inc. is evaluating two capital investment proposals for a retail outlet, each requiring an investment of 975,000 and each with a seven-year life and expected total net cash flows of 1,050,000. Location 1 is expected to provide equal annual net cash flows of 150,000, and Location 2 is expected to have the following unequal annual net cash flows: Determine the cash payback period for both location proposals.arrow_forwardNet present value method, internal rate of return method, and analysis for a service company The management of Advanced Alternative Power Inc. is considering two capital investment projects. The estimated net cash flows from each project are as follows: The wind turbines require an investment of 887,600, while the biofuel equipment requires an investment of 911,100. No residual value is expected from either project. Instructions 1. Compute the following for each project: A. The net present value. Use a rate of 6% and the present value of an annuity table appearing in Exhibit 5 of this chapter. B. A present value index. (Round to two decimal places.) 2. Determine the internal rate of return for each project by (A) computing a present value factor for an annuity of 1 and (B) using the present value of an annuity of 1 table appearing in Exhibit 5 of this chapter. 3. What advantage does the internal rate of return method have over the net present value method in comparing projects?arrow_forward
- Clearcast Communications Inc. is considering allocating a limited amount of capital investment funds among four proposals. The amount of proposed investment, estimated operating income, and net cash flow for each proposal are as follows: The companys capital rationing policy requires a maximum cash payback period of three years. In addition, a minimum average rate of return of 12% is required on all projects. If the preceding standards are met, the net present value method and present value indexes are used to rank the remaining proposals. Instructions 1. Compute the cash payback period for each of the four proposals. 2. Giving effect to straight-line depreciation on the investments and assuming no estimated residual value, compute the average rate of return for each of the four proposals. Round to one decimal place. 3. Using the following format, summarize the results of your computations in parts (1) and (2). By placing the computed amounts in the first two columns on the left and by placing a check mark in the appropriate column to the right, indicate which proposals should be accepted for further analysis and which should be rejected. 4. For the proposals accepted for further analysis in part (3), compute the net present value. Use a rate of 12% and the present value table appearing in Exhibit 2 of this chapter. 5. Compute the present value index for each of the proposals in part (4). Round to two decimal places. 6. Rank the proposals from most attractive to least attractive, based on the present values of net cash flows computed in part (4). 7. Rank the proposals from most attractive to least attractive, based on the present value indexes computed in part (5). 8. Based on the analyses, comment on the relative attractiveness of the proposals ranked in parts (6) and (7).arrow_forwardNet present value method, present value index, and analysis for a service company First United Bank Inc. is evaluating three capital investment projects by using the net present value method. Relevant data related to the projects are summarized as follows: Instructions 1. Assuming that the desired rate of return is 15%, prepare a net present value analysis for each project. Use the present value table appearing in Exhibit 2 of this chapter. 2. Determine a present value index for each project. (Round to two decimal places.) 3. Which project offers the largest amount of present value per dollar of investment? Explain.arrow_forwardCapital Rationing Decision for a Service Company Involving Four Proposals Renaissance Capital Group is considering allocating a limited amount of capital investment funds among four proposals. The amount of proposed investment, estimated income from operations, and net cash flow for each proposal are as follows: Investment Year Income from Operations Net Cash Flow Proposal A: $680,000 1 $64,000 $200,000 2 64,000 200,000 3 64,000 200,000 4 24,000 160,000 5 24,000 160,000 $240,000 $920,000 Proposal B: $320,000 1 $26,000 $90,000 2 26,000 90,000 3 6,000 70,000 4 6,000 70,000 5 (44,000) 20,000 $20,000 $340,000 Proposal C: $108,000 1 $33,400 $55,000 2 31,400 53,000 3 28,400 50,000 4 25,400 47,000 5 23,400 45,000 $142,000 $250,000 Proposal D: $400,000 1 $100,000 $180,000 2 100,000 180,000 3 80,000 160,000 4 20,000…arrow_forward
- Capital Rationing Decision for a Service Company Involving Four Proposals Renaissance Capital Group is considering allocating a limited amount of capital investment funds among four proposals. The amount of proposed investment, estimated operating income, and net cash flow for each proposal are as follows: Investment Year Operating Income Net Cash Flow Proposal A: $680,000 1 $ 64,000 $ 200,000 2 $ 64,000 200,000 3 64,000 200,000 4 24,000 160,000 5 24,000 160,000 240,000 920,000 Proposal B: $320,000 1 $ 26,000 90,000 2 26,000 90,000 3 6,000 70,000 4 6,000 70,000 5 (44,000) 20,000 20,000 340,000 Proposal C: $108,000 1 $ 33,400 55,000 2 31,400 53,000 3 28,400 50,000 4 25,400 47,000 5 23,400 45,000 142,000 250,000 Proposal D: $400,000 1 $ 100,000 180,000 2…arrow_forwardRenaissance Capital Group is considering allocating a limited amount of capital investment funds among four proposals. The amount of proposed investment, estimated income from operations, and net cash flow for each proposal are as follows: Investment Year Income from Operations Net Cash Flow Proposal A: $680,000 1 $64,000 $200,000 2 64,000 200,000 3 64,000 200,000 4 24,000 160,000 5 24,000 160,000 $240,000 $920,000 Proposal B: $320,000 1 $26,000 $90,000 2 26,000 90,000 3 6,000 70,000 4 6,000 70,000 5 (44,000) 20,000 $20,000 $340,000 Proposal C: $108,000 1 $33,400 $55,000 2 31,400 53,000 3 28,400 50,000 4 25,400 47,000 5 23,400 45,000 $142,000 $250,000 Proposal D: $400,000 1 $100,000 $180,000 2 100,000 180,000 3 80,000 160,000 4 20,000 100,000 5 0 80,000 $300,000 $700,000 The company's…arrow_forwardRenaissance Capital Group is considering allocating a limited amount of capital investment funds among four proposals. The amount of proposed investment, estimated income from operations, and net cash flow for each proposal are as follows: Investment Year Income from Operations Net Cash Flow Proposal A: $680,000 1 $64,000 $200,000 2 64,000 200,000 3 64,000 200,000 4 24,000 160,000 5 24,000 160,000 $240,000 $920,000 Proposal B: $320,000 1 $26,000 $90,000 2 26,000 90,000 3 6,000 70,000 4 6,000 70,000 5 (44,000) 20,000 $20,000 $340,000 Proposal C: $108,000 1 $33,400 $55,000 2 31,400 53,000 3 28,400 50,000 4 25,400 47,000 5 23,400 45,000 $142,000 $250,000 Proposal D: $400,000 1 $100,000 $180,000 2 100,000 180,000 3 80,000 160,000 4 20,000 100,000 5 0 80,000 $300,000 $700,000 The company's…arrow_forward
- Renaissance Capital Group is considering allocating a limited amount of capital investment funds among four proposals. The amount of proposed investment, estimated income from operations, and net cash flow for each proposal are as follows: Investment Year Income from Operations Net Cash Flow Proposal A: $680,000 1 $64,000 $200,000 2 64,000 200,000 3 64,000 200,000 4 24,000 160,000 5 24,000 160,000 $240,000 $920,000 Proposal B: $320,000 1 $26,000 $90,000 2 26,000 90,000 3 6,000 70,000 4 6,000 70,000 5 (44,000) 20,000 $20,000 $340,000 Proposal C: $108,000 1 $33,400 $55,000 2 31,400 53,000 3 28,400 50,000 4 25,400 47,000 5 23,400 45,000 $142,000 $250,000 Proposal D: $400,000 1 $100,000 $180,000 2 100,000 180,000 3 80,000 160,000 4 20,000 100,000 5 0 80,000 $300,000 $700,000 The company's…arrow_forwardRenaissance Capital Group is considering allocating a limited amount of capital investment funds among four proposals. The amount of proposed investment, estimated income from operations, and net cash flow for each proposal are as follows: Investment Year Income from Operations Net Cash Flow Proposal A: $680,000 1 $64,000 $200,000 2 64,000 200,000 3 64,000 200,000 4 24,000 160,000 5 24,000 160,000 $240,000 $920,000 Proposal B: $320,000 1 $26,000 $90,000 2 26,000 90,000 3 6,000 70,000 4 6,000 70,000 5 (44,000) 20,000 $20,000 $340,000 Proposal C: $108,000 1 $33,400 $55,000 2 31,400 53,000 3 28,400 50,000 4 25,400 47,000 5 23,400 45,000 $142,000 $250,000 Proposal D: $400,000 1 $100,000 $180,000 2 100,000 180,000 3 80,000 160,000 4 20,000 100,000 5 0 80,000 $300,000 $700,000 The company's…arrow_forward
 Survey of Accounting (Accounting I)AccountingISBN:9781305961883Author:Carl WarrenPublisher:Cengage Learning
 Intermediate Financial Management (MindTap Course...FinanceISBN:9781337395083Author:Eugene F. Brigham, Phillip R. DavesPublisher:Cengage Learning
 Managerial AccountingAccountingISBN:9781337912020Author:Carl Warren, Ph.d. Cma William B. TaylerPublisher:South-Western College Pub
 Financial And Managerial AccountingAccountingISBN:9781337902663Author:WARREN, Carl S.Publisher:Cengage Learning,