
Review Figure 3.4. Suppose the
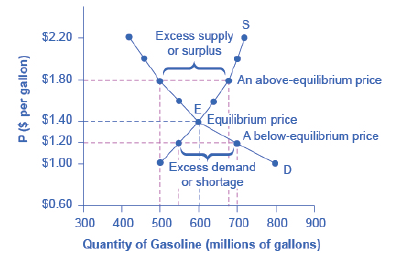
Figure 3.4 Demand and Supply of Gasoline
If the price of gasoline is $1.60 per gallon and the equilibrium price is $1.40 per gallon. Comment whether the quantity demanded and supplied is higher or lower at $1.60 per gallon. Is there a shortage or surplus?
Explanation of Solution
As per the diagram, the equilibrium price is $1.40 per gallon in the market. Any price above the equilibrium price level in the market creates surplus of the product in the market and any price below the equilibrium price creates a shortage of the product in the market.
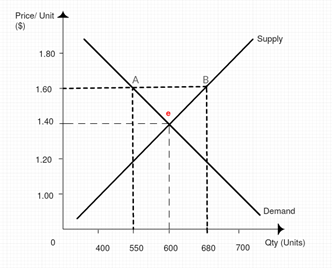
In the above figure, at price level $1.60 per gallon, the quantity demand is 550 millions of gallons and quantity supply is 680 million gallons, represented by point A and B in the diagram. Clearly, we can see that quantity supply is more than quantity demand and there is a surplus of the product.
If the price is below the equilibrium price, then there will be shortage of the product.
Equilibrium Price: It is that level of price where demand of a product is equal to the supply of a product.
Want to see more full solutions like this?
Chapter 3 Solutions
Principles of Economics 2e
Additional Business Textbook Solutions
Principles of Accounting Volume 2
Cost Accounting (15th Edition)
Horngren's Cost Accounting: A Managerial Emphasis (16th Edition)
Managerial Accounting (5th Edition)
Financial Accounting (12th Edition) (What's New in Accounting)
Construction Accounting And Financial Management (4th Edition)

- The table below illustrates the market's demand and supply for cheddar cheese. Price Per Pound[$] Quantity demanded Quantity Supplied 3.00 320 200 3.50 280 220 4.00 240 240 4.50 200 260 5.00 160 280 A new study says that eating cheese is good for your health, so that demand increases by 30% at every price. What is the equilibrium quantity in the market after the study?arrow_forwardThe below table gives an annual demand and supply schedules for cars. 1. Plot the graph with demand and supply curves using this schedule.(Use table below)2. Show equilibrium price and equilibrium quantity.3. Calculate shortage at price $15. Calculate surplus at price $30.4. If quantity supplied increases by 2 products, what is the newequilibrium (don’t show this on a graph)arrow_forwardThe data in the table above represent the market demand and supply for strawberries over a range of prices. Price(Cents) Quantity Demand(Million tin/ year) Quantity supplied(Million tins/year) 10 90 30 20 80 50 30 70 70 40 60 90 50 50 110 4.Define the equilibrium of a market. Find the equilibrium price and quantity. 5.Suppose that an increase in consumers’ income results in an increase of strawberries’ demand.The demand of strawberries rises by 30 million tins/year at each price level. Find the new equilibrium price and quantity.arrow_forward
- Price ($/cup) 4 3.5 3 2.5 2 1.5 1 0.5 0 0 10 20 Original Supply A decrease in the price of coffee beans. New Demand Original Demand 30 40 50 60 70 80 90 Quantity (cups/hour) New Supply The figure above refers to the market for coffee. What might cause a shift from the original demand curve to the new demand curve? Check all that apply. An increase in the price of tea (a substitute for coffee). A decrease in income if coffee is an inferior good. An expectation that coffee prices will fall in the future. A decrease in the price of cream (a complement to coffee)arrow_forwardThe below table gives an annual demand and supply schedules for cars. 1. Plot the graph with demand and supply curves using this schedule.(Use table below)2. Show equilibrium price and equilibrium quantity.3. Calculate shortage at price $15. Calculate surplus at price $30.4. If quantity supplied increases by 2 products, what is the newequilibrium (don’t show this on a graph) Kindly answer all partsarrow_forward1) What is the equilibrium price and quantity? 2) What price level will create a shortage of 40 units? 3) What price level will create a surplus of 40 units? 4) Using the midpoint formula, what is the price elasticity of demand if the price changes $1.00 to $1.10? 5) Using the midpoint formula, what is the price elasticity of demand if the price changes $1.10 to $1.50? 6) If a price floor is established at $1.30, a (shortage, surplus, neither, SELECT ONE will develop). If you selected a shortage ot surplus, what will be the quantitative imbalance (number)? 7) If a price floor is established at $1.00, a (shortage, surplus, neither, SELECT ONE will develop). If you selected a shortage ot surplus, what will be the quantitative imbalance (number)? 8) If a price ceiling is established at $0.90, a (shortage, surplus, neither, SELECT ONE will develop). If you selected a shortage ot surplus, what will be the quantitative imbalance (number)? 9) If a price ceiling is established at $1.30, a…arrow_forward
- The table shows the quantity of tablets that is demanded and supplied at various prices. Quantity Demanded Quantity Supplied Price 50 75 100 125 120,000 112,500 105,000 97,500 100,000 102,500 105,000 107,500 Assume that the new equilibrium price is $50. How much would quantity supplied need to increase at each price to reach this equilibrium? A) 2550 B) 5050 C) 20,000 D) 112,499arrow_forwardPlease explain using demand and supply graphs to determine equilibrium price and quantity, or surplus and shortagesarrow_forward
 Principles of Economics 2eEconomicsISBN:9781947172364Author:Steven A. Greenlaw; David ShapiroPublisher:OpenStax
 Economics (MindTap Course List)EconomicsISBN:9781337617383Author:Roger A. ArnoldPublisher:Cengage Learning
 Principles of MicroeconomicsEconomicsISBN:9781305156050Author:N. Gregory MankiwPublisher:Cengage Learning
 Brief Principles of Macroeconomics (MindTap Cours...EconomicsISBN:9781337091985Author:N. Gregory MankiwPublisher:Cengage Learning