
Graphical Representation of
Explanation of Solution
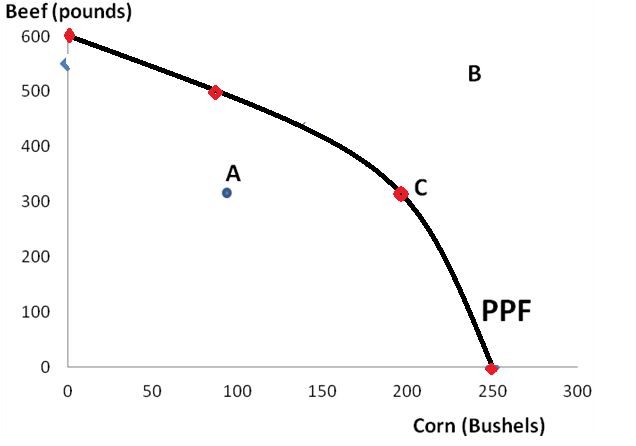
Inefficient points are those in which resources are not fully utilized or are wasted. Economy is producing output inside Production possibility curve. Point A is inefficient as 300 pounds of beef and 100 bushel of corn is produced. At this point, resources are wasted.
Unattainable combinations are such which lie outside PPF curve. These are the combination of output production which cannot be produced as resources are not available for such combination. Point B in unattainable point in the above figure.
Efficient Point: Production is said to be efficient at which an economy can produce maximum output using its existing resources. There is no scope of increasing production, only alteration can be done. Resources are fully employed and attainable. Point C is efficient point.
Concept Introduction:
Production efficiency is the level of optimum level at which am economy can produce maximum output using its existing resources. There is no scope of increasing production, only alteration can be done.
An inefficient output is one in which more output of one good is produced without reducing the other good's output.
Want to see more full solutions like this?
Chapter 3 Solutions
Foundations of Economics (8th Edition)

- ple Choice ý the letter of the choice that best completes the statement or answers the question. 1. Which of the following is an example of lower production costs brought about by the use of technology? the delivery costs of gasoline to the consumer by diesel trucks the use of e-mail to replace slower surface mail а. b. the making of breads and pastries in local shops rather than large bakeries the importing of fresh vegetables from South America rather than using canned vegetables- с. d. 2. What is the effect of import restrictions on prices? They cause prices to drop. b. a. They cause prices to rise. They often cause prices to rise steeply and then drop. d. They usually do not have any lasting effect on price. с. 3. What do sellers do if they expect the price of goods they have for sale to increase dramatically in the future? sell the goods now and try to invest the money instead of resupplying sell the goods now but try to get the higher price for them store the goods until the…arrow_forward140 120 100 20 PPP 10 20 30 40 50 60 70 80 90 100 Quantity of rubber hoses (Figure: Figure: Rubberland's Production Possibilities) Rubberland only makes two products, rubber band balls and rubber hoses, and on a given day can produce according to the lighter PPF curve in the graph. Point A on the lighter PPF curve represents the combination of the two goods Rubberland currently produces. When a new method of rubber processing is discovered, the PPF shifts to the right, the darker PPF curve. Assume that Rubberland does not make more rubber hoses than they originally made at point A but still maximize their productive capabilities. How many more rubber hand balls do they now produce per day than before? O 59 O 30 O 20 Q 39 Quantity of rubber hnd hallsarrow_forwardUse the following table to answer the question below. Jake's Production Possibilities Schedule Jane's Production Possibilities Schedule Pounds of Green Pounds of Corn Pounds of Green Pounds of Corn Beans Beans 160 80 10 120 20 60 40 20 80 40 30 40 60 20 40 80 Jake should specialize in the production of which good? neither both corn O green beansarrow_forward
- 3. A farm grows wheat and produces pork. The marginal cost of producing each of these products increases as more of it is produced. a. Make a graph that illustrates the farm's PPF. b. The farm adopts a new technology that allows it to use fewer resources to fatten pigs. Use your graph to illustrate the impact of the new technology on the farm's PPF. c. With the farm using the new technology described in part (b), has the opportunity cost of producing a ton of wheat increased, decreased, or remained the same? Explain and illustrate your answer. d. Is the farm more efficient with the new technology than it was with the old one? Why?arrow_forward5. Draw a Production Possibilities Graph for Toyota using the following information: A B C E F Trucks 20 28 35 40 43 45 Cars 54 52 49 43 35 25 A. Which combination(s) on the graph are considered efficient?arrow_forward8. What is economic?arrow_forward
- Nick and Rosa are farmers. Each one owns a 20-acre plot of land. The following table shows the amount of barley and alfalfa each farmer can produce per year on a given acre. Each farmer chooses whether to devote all acres to producing barley or alfalfa or to produce barley on some of the land and alfalfa on the rest. Barley (Bushels per acre) (Bushels per acre) Alfalfa Nick 10 5 Rosa 40 8 On the following graph, use the blue line (circle symbol) to plot Nick's production possibilities frontier (PPF), and use the purple line (diamond symbol) to plot Rosa's PPF. (?) Nick's PPF 10 140 120 Rosa's PPF 180 40 20 180 200 300 40 sa0 a0 700 0 s00 1000 BARLEY (Bushela * has an absolute advantage in the production of barley, and has an absolute advantage in the production of alfalfa. Nick's opportunity cost of producing 1 bushel of alfalfa is bushels of barley, whereas bushels of barley. Because * has a comparative Rosa's opportunity cost of producing 1 bushel of alfalfa is Nick has a opportunity…arrow_forwardUse relevant diagram(s) and indicate production and consumption efficiency. State the conditions for production and consumption efficiency.arrow_forward(Figure: Recliners and Couches) American Signature is a furniture company based in Columbus, Ohio. The graph represents American Signature's production possibility frontier for manufacturing couches and recliners. If American Signature manufactures 100,000 couches and 400,000 recliners, the company's use of resources would be , and the company could production. Ⓒa. inefficient; decrease Ob. efficient, increase O c. efficient; decrease Od. inefficient; increasearrow_forward
- Figure 1 shows the PPF for an economy that produces Food and Clothes. What is the maximum amount of food that the economy can produce if it produces 48 clothes? A) 50 Food B) 320 Food C) 440 Food D) 500 Foodarrow_forwardWhat is a ‘final good’? Select one: a. A good not used as an input in the production process b. A natural resource used to produce a good c. A good purchased as an input in the production process d. A good used in the production of another goodarrow_forwardHow do I graph the amount of fertilizer that needs to be added to an acre of land and the amount of corn grown on that land in a season?arrow_forward

 Principles of Economics (12th Edition)EconomicsISBN:9780134078779Author:Karl E. Case, Ray C. Fair, Sharon E. OsterPublisher:PEARSON
 Engineering Economy (17th Edition)EconomicsISBN:9780134870069Author:William G. Sullivan, Elin M. Wicks, C. Patrick KoellingPublisher:PEARSON
 Principles of Economics (MindTap Course List)EconomicsISBN:9781305585126Author:N. Gregory MankiwPublisher:Cengage Learning
 Managerial Economics: A Problem Solving ApproachEconomicsISBN:9781337106665Author:Luke M. Froeb, Brian T. McCann, Michael R. Ward, Mike ShorPublisher:Cengage Learning
 Managerial Economics & Business Strategy (Mcgraw-...EconomicsISBN:9781259290619Author:Michael Baye, Jeff PrincePublisher:McGraw-Hill Education