
Concept explainers
Videos
Using Regression to Calculate Fixed Cost, Calculate the Variable Rate, Construct a Cost Formula, and Determine Budgeted Cost
Refer to the information for Speedy Pete’s on the previous page. Coefficients shown by a regression program for Speedy Pete’s data are:
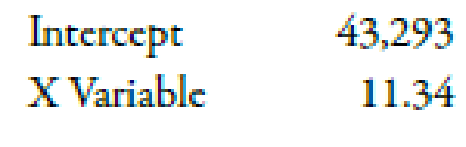
Required:
Use the results of regression to make the following calculations:
- 1. Calculate the fixed cost of deliveries and the variable rate per delivery.
- 2. Construct the cost formula for total delivery cost.
- 3. Calculate the budgeted cost for next month, assuming that 3,000 deliveries are budgeted. (Note: Round answers to the nearest dollar.)
Use the following information for Brief Exercises 3-26 through 3-29:
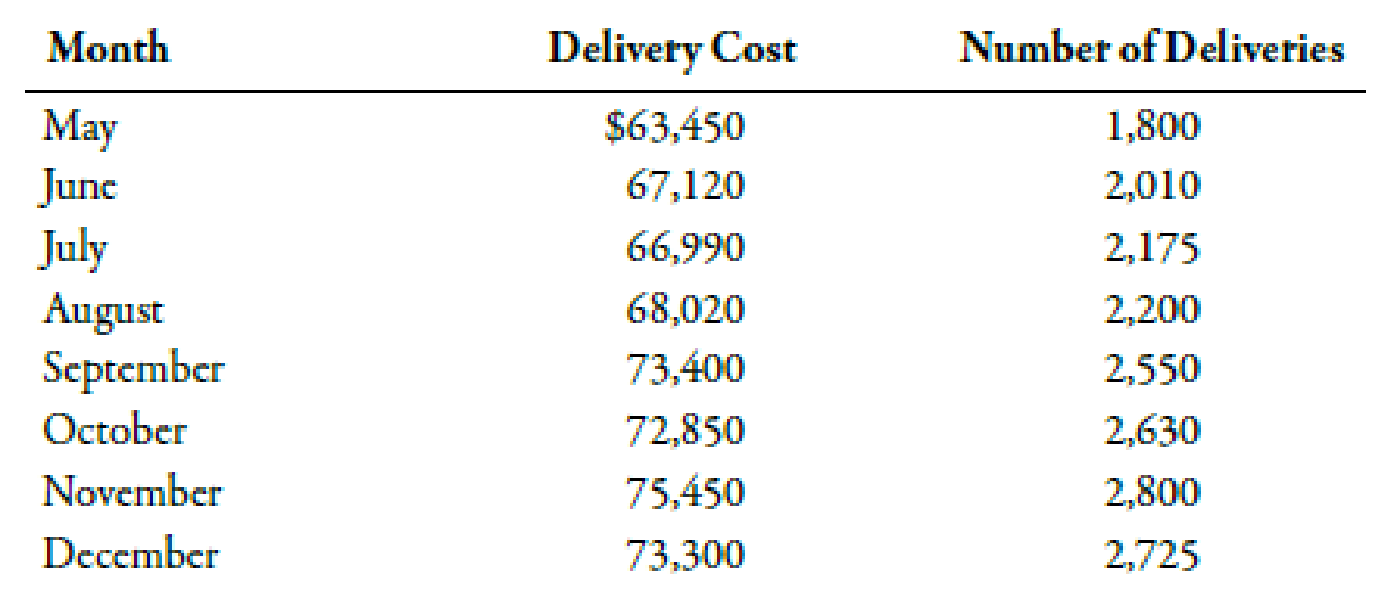
Speedy Pete’s is a small start-up company that delivers high-end coffee drinks to large metropolitan office buildings via a cutting-edge motorized coffee cart to compete with other premium coffee shops. Data for the past 8 months were collected as follows:

Trending nowThis is a popular solution!

Chapter 3 Solutions
Managerial Accounting: The Cornerstone of Business Decision-Making


- Carter Dry Cleaning has developed two regression analyses for cost estimation. The accounting manager has presented statistical measures for both of these regressions. Regression A has an R-squaredvalue of .53 and a t-value of 1.08. Regression B has an R-squared of .89 and a t-value of 2.17. Whatdo these statistical measures indicate about the regressions? Which regression should Carter DryCleaning use for cost estimation?arrow_forwardWhich of the following statements related to cost estimation methods is true ? a . Only high -low method has a slope and an intercept . b. The scatter - graph method is used to derive an estimated line of cost behavior by graphically connecting the two cost amounts identified with the highest and lowest volume levels . c. The most complex method of cost estimation is the high - low method . d. The least -squares regression method is the most accurate and reliable method to determine the cost behavior compared to scatter -graph plot and high -low methods . e. None of the given answersarrow_forwardEstimate the cost equation using the high-low method, and draw this line on your graph.arrow_forward
- Using High-Low to Calculate Fixed Cost, Calculate theVariable Rate, and Construct a Cost FunctionRefer to the information for Speedy Pete’s above. Speedy Pete’s controller wants to calculate thefixed and variable costs associated with its cutting-edge delivery service.Required:Using the high-low method, calculate the fixed cost of deliveries, calculate the variable rate perdelivery, and construct the cost formula for total delivery costarrow_forwardWrite cost pool, cost driver, activity cost, budgeting. What are the assumption of CVP analysis? What is BEP point? Draw a CVP graph.arrow_forward_____Identifying the relationship between the activity and the costs is a key step in which of the following cost estimation methods? a) Scattergraph. b) High-low method. c) Linear regression. d) Account analysis.arrow_forward
- Can you provide samples/examples of tasks for developing the costing and profitability model for a new product? Should include the following: o A table showing the list of the parameters used in your model o A breakdown of the expected production costs and profitability o Calculation of the NPV of expected sales/ profitability o A sensitivity analysis that accounts for changes in any three (3) parameters of your model. o At least two trade-off rules you developed for your product developmentarrow_forwardWhich of the following are assumptions associated with the cost equation? Check all that apply. The cost equation is used to estimate costs at a variety of volume levels Cost estimates are valid within a discrete range of volumes Per unit variable costs represent the slope of a cost equation Cost equations are lineararrow_forwardWhat are the Costs per unit of Alfa and Beta under traditional and ABC costing systems? What would be the prices of Alpha and Beta traditional and ABC costing systems? Compare the costs and prices calculated in the two systems. Please write down the calculation process!thanks!!!arrow_forward
- An analyst has started preparing a spreadsheet as shown below. Column A contains the headings for various parameters and Column B contains the analyst's range names to be used in Excel. A 1 Price per Unit 2 Cost per Unit 3 Profit per Unit Price_per_Unit Cost per Unit Profit$_per_Unit 4. 5 Fixed Costs 6 Variable Costs Fixed Costs VariableCosts Label each of the following range names as "Correct" if is a valid range name in Excel or "Incorrect" if the range name is not valid for use in Excel. Proposed Range Name Price_per_Unit Cost per Unit Profit$_per_Unit Fixed Costs VariableCostsarrow_forwardA total cost equation can be used to predict future costs for various activity levels. Write the total cost equation. 4. In the total cost equation: a) What is the slope? b) What is the independent variable? c) What is the dependent variable?arrow_forwardWhich of the following methods of cost estimation relies on only two data points? A. the high-low method B. account analysis C. least-squares regression D. SWOT analysis.arrow_forward
 Managerial Accounting: The Cornerstone of Busines...AccountingISBN:9781337115773Author:Maryanne M. Mowen, Don R. Hansen, Dan L. HeitgerPublisher:Cengage Learning
 Principles of Cost AccountingAccountingISBN:9781305087408Author:Edward J. Vanderbeck, Maria R. MitchellPublisher:Cengage Learning
 Principles of Accounting Volume 2AccountingISBN:9781947172609Author:OpenStaxPublisher:OpenStax College