
Concept explainers
Videos
a.
Find the values
a.
Answer to Problem 18P
The values of
The values of
Explanation of Solution
Step-by-step procedure to verify
- Press STAT.
- Select Edit.
- Enter the values in L1.
- Press STAT and Choose CALC.
- Select 1-Var Stats.
- To select the variable L1, Press 2-nd, and then press 1.
- Press Enter.
Output obtained using the Ti83 calculator is given below:
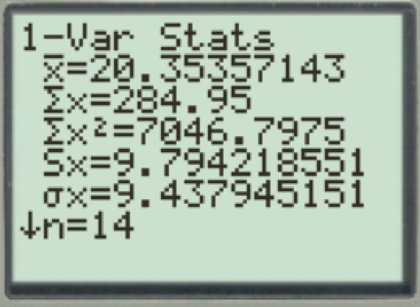
From the output, the values of
Step-by-step procedure to verify
- Press STAT.
- Select Edit.
- Enter the values in L2.
- Press STAT and Choose CALC.
- Select 1-Var Stats.
- To select the variable L2, Press 2-nd, and then press 2.
- Press Enter.
Output obtained using the Ti83 calculator is given below:
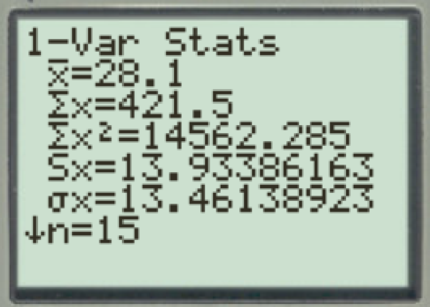
From the output, the values of
b.
Find the sample
b.
Answer to Problem 18P
The values of sample mean, variance, and standard deviation for x using the computation formula is 20.35, 96 and 9.79.
The values of sample mean, variance, and standard deviation for y using the computation formula is 28.1, 194 and 13.93.
Explanation of Solution
The sample variance using the computation formula is as follows:
Where,
The sample standard deviation using the computation formula is as follows:
Where,
The sample mean for x is obtained below:
Thus, the sample mean is 20.35.
The sample variance for x using the computation formula is obtained below:
Thus, the sample variance for x using the computation formula is 96.
The sample standard deviation for x using the computation formula is obtained below:
Thus, the sample standard deviation for x using the computation formula is 9.79.
The sample mean for y is obtained below:
Thus, the sample mean is 28.1.
The sample variance for y using the computation formula is obtained below:
Thus, the sample variance for y using the computation formula is 194.
The sample standard deviation for y using the computation formula is obtained below:
Thus, the sample standard deviation for y using the computation formula is 13.93.
c.
Find the 75% Chebyshev interval around the mean for each fund.
Compare the two grids.
c.
Answer to Problem 18P
The 75% Chebyshev interval around the mean for the Grid E is 0.77 and 39.93.
The 75% Chebyshev interval around the mean for the Grid H is 0.24 and 55.96.
Explanation of Solution
The 75% Chebyshev interval around the mean for the Grid Eis obtained below:
Thus, the 75% Chebyshev interval around the mean for the Grid E is 0.77 and 39.93.
The 75% Chebyshev interval around the mean for the Grid H is obtained below:
Thus, the 75% Chebyshev interval around the mean for the Grid H is 0.24 and 55.96.
From the result, it is observed that the 75% Chebyshev interval around the mean for the Grid H is wider when compared to the Grid E.
d.
Find and compare the coefficient of variation for x and y.
d.
Answer to Problem 18P
The coefficient of variation for x is 48%.
The coefficient of variation for y is 50%.
Explanation of Solution
The formula for the coefficient of variation is as follows:
Where, s is the sample standard deviation and
The coefficient of variation for x is obtained below:
Thus, the coefficient of variation for x is 48%.
The coefficient of variation for y is obtained below:
Thus, the coefficient of variation for y is 50%.
From the results, the coefficient of variation for the Grid E is less when compared to the coefficient of variation for the Grid H. Hence, the Grid H has more buried artifacts.
Want to see more full solutions like this?
Chapter 3 Solutions
Understandable Statistics: Concepts and Methods


 Holt Mcdougal Larson Pre-algebra: Student Edition...AlgebraISBN:9780547587776Author:HOLT MCDOUGALPublisher:HOLT MCDOUGAL
 Algebra & Trigonometry with Analytic GeometryAlgebraISBN:9781133382119Author:SwokowskiPublisher:Cengage
