
Downward sloping of aggregate demand curve.
Explanation of Solution
The aggregate demand (AD) curve shows an inverse relation between
The aggregate demand curve slopes downward due to three reasons:
Real balance effect: A change in the price level produces the real balance effect. A rise in the price level, results in a decrease in the
Interest Rate Effect: Assuming the money supply in the economy to be fixed, rise in price level implies more money required for purchases and pay for inputs. So, an increase in money demanded would increase the price paid for it, that is. the interest rate. The rise in interest rate will increase the borrowing costs which decrease the investment expenditure. This will decrease the quantity of real output demanded, thus decreasing the aggregate demand.
Foreign Purchases Effect: It is one of the key reasons behind the sloping of the aggregate demand curve. When the domestic price level rises relative to foreign price levels, foreigners buy fewer domestic goods as it becomes more expensive and people (domestic) opt for more foreign goods. Therefore, the export of domestic goods decline and import of foreign goods rise. As a result, there will be a decline in the overall demand for our domestic output. Thus the aggregate quantity demanded of GDP will decline. This slopes the AD curve downwards.
The reasons for downward sloping of AD curve are different from the reason for downward sloping of demand curve of a single-product. Assuming, a constant money income, substitution effect can work on a single product, whereby dropping prices of a single product make it relatively cheaper product compared to the other products whose price have not been changed. Also, the consumer has become richer in real terms, as he could afford more of the product whose price has been declined. But with the AD curve, as all the prices are falling implies dropping of the price level, thus single product substitution effect is not applicable in AD curve. Also, while dealing with demand of a single product, money income is assumed to be fixed. But this assumption is not applicable in case of AD curve because with regard to the circular flow of the economy, lower prices indicate lower incomes. Thus a decline in the price level does not necessarily imply an increase in the nominal income of the economy as a whole since as prices are dropping, so are the receipts or revenue of the sellers.
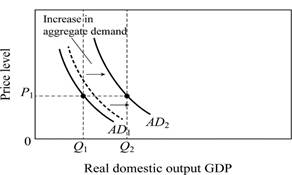
Figure-1
The multiplier effect acts on the initial change in spending to generate an even greater shift in the aggregate demand curve.
For instance, Figure 1 shows how multiplier effect works on an increase in income expenditure. The initial increase in spending is reflected by the broken line of AD curve, and then multiplier effect shift the AD curve from AD1 to AD2.
Concept Introduction:
Aggregate Demand: It refers to the total value of the goods and services available for purchase at a particular price in a given period of time.
Multiplier effect: Multiplier refers to the ratio of change in the real GDP to the change in initial consumption at constant price rate. Multiplier is positively related to the marginal propensity to consumer and negatively related with the marginal propensity to save.
Want to see more full solutions like this?
Chapter 32 Solutions
Economics (Irwin Economics)

- Which of the following changes in personal income tax would lead to the smallest increase in consumption? O a. O b. a $15 000 decrease in taxes, if MPC equals 0.6 O c. a $30 000 decrease in taxes, if MPC equals 0.25 Oe. a $20 000 decrease in taxes, if MPC equals 0.5 O d. a $12 000 decrease in taxes, if MPC equals 0.75 a $10 000 decrease in taxes, if MPC equals 0.2arrow_forwardIntended Spending (billions) $2,300 $2,100 $1,900 $1,700 $1,500 The marginal propensity to consume is 01 O 19/21. O 2/3. O 5/7. 45% $1,500 $1,800 $2,100 $2,400 $2,700 Gross Domestic Product (billions) impossible to tell from the graph. Consumption plus investment Consumptionarrow_forward2. L Give Up! Suppose the Japanese economy has been experiencing slow growth. As a result, the Prime Minister, who thinks John Maynard Keynes was the greatest economist ever, has decided to increase government spending. The Prime Minister asks the head of the economic council to determine the increase in government spending necessary to bring the economy to full employment. Assume there is a GDP gap of 1 trillion yen and the marginal propensity to consume (MPC) is 0.60. What advice should the head of the economic council give the Prime Minister? O The recessionary gap is equal to 400 billion yen. O The inflationary gap is equal to 400 billion yen. O The recessionary gap is equal to 625 billion yen. O The inflationary gap is equal to 625 billion yen.arrow_forward
- Planned Aggregate Spending (billions of dollars) 200 180 160 140 120 100 80 60 O 0.5 40 20 O 0.95 0 O 0.85 0 20 O 0.75 C 1 Question 8 40 1 1 1 1 O none of the answers given is correct A 7. What is MPC if this hypothetical economy were to move the macroeconomic poin A? B 45 degree line Planned AE New Planned AE 60 80 100 120 140 160 180 200 Real GDP (in billions of dollars)arrow_forwardLAST WORD What is Say's law? How does it relate to the view held by classical economists that the economy generally will operate at a position on its production possibilities curve? Use production possibilities analysis to demonstrate Keynes's view on this matter.arrow_forwardUse the table below to answer the following question. Income (Dollars) 20,000 24,000 O 0.75 What is the marginal propensity to consume? O 0.875 O 0.90 Consumption (Dollars) O 1.33 18,000 21,500arrow_forward
- 4. Suppose that the table below shows an economy's relationship between real output and the inputs needed to produce that output: LO4 Input Quantity Real GDP 150.0 $400, 112.5 300 75.0 200 a. What is productivity in this economy? b. What is the per-unit cost of production if the price of each input unit is $2? c. Assume that the input price increases from $2 to $3 with no accompanying change in productivity. What is the new per-unit cost of production? In what direction would the $1 increase in input price push the economy's aggregate supply curve? What effect would this shift of aggregate supply have on the price level and the level of real output? d. Suppose that the increase in input price does not occur but, instead, that productivity increases by 100 percent. What would be the new per-unit cost of production? What effect would this change in per-unit production cost have on the economy's aggregate supply curve? What effect would this shift of aggregate supply have on the price…arrow_forwardWhat is the initial change in consumption if an economy's MPC is 0.75 and there is a decrease in taxes of $1 billion? O $1.75 billion O $1 billion O $1.33 billion O $0.75 billionarrow_forwardFigure: Aggregate Expenditures Curve II Aggregate expenditures (per year) $800 Reference: Ref 11-16 45-degree line AE $2,000 Real GDP (per year) (Figure: Aggregate Expenditures Curve II) The slope of the aggregate expenditures curve in the aggregate expenditures model shown in this figure is: O 45 degrees. O 0.6. O 0.5. O 0.25.arrow_forward
- 1. Aggregate expenditures and income The following table shows consumption (C), investment (1), government spending (G), and net exports (X-M) in a hypothetical economy for various levels of real GDP (Y). Assume that the price level remains unchanged at all levels of income. All figures are in billions of dollars. Compute aggregate expenditures for each income level and fill in the last column In the following table. Y с G 500 525 250 150 600 550 250 150 575 250 150 600 250 150 -200 900 625 250 150 -200 700 800 AL AGGREGATE EXPENDITURES (Billions of dollars) The following graph shows real GDP on the horizontal axis and aggregate expenditures (AE) on the vertical axis. The orange line (square symbols) represents a 45-degree (Y-AE) line. 1000 Use the blue points (circle symbol) to plot the aggregate expenditures line for this economy. Line segments will automatically connect the points. 900 300 I 700 X-M Aggregate Expenditures -200 725 -200 750 775 800 825 600 500 + -200 AE line *+…arrow_forwardFill in the missing portion of the following table and answer the following questions: (Billions) (Negative figures are surpluses) Year 2007 2008 2009 2010 2011 Potential Nominal GDP O248 billion O262 billion O 413 billion O 348 billion 14,449 14,981 15,310 15,647 16.134 Actual Nominal GDP 14,478 14,719 14,419 14,964 15,518 Shortfall in Output -29 262 892 682 616 Tax Rate 25% 25% 25% 25% 25% What was the structural budget deficit in 2008? Actual Budget Deficit (Minus Automatic Stabilizors) 183 413 1,063 877 891 Cyclical Budget Deficit S 66 154 Structural Budget Deficit 190 707 Actual Budgot Deficit % of GDP 1.26% 5.86% 5.74%arrow_forwardRefer to the information provided in Figure 1 below to answer the questions that follow Figure 1 AE 1,600 400 S450 1,600 Aggregate output, Y (billions of dollars) 10. Refer to Figure 1. Which of the following equations best represents the aggregate expenditure function? O AE = 1,200 + 0.8Y. %3D O AE 1,600 + 0.4Y. %3D O AE = 1,000 + 0.5Y. %3D AE = 400+ 0.75Y. Planned aggregate expenditure, AE (billions of dollars)arrow_forward

 Principles of Economics (12th Edition)EconomicsISBN:9780134078779Author:Karl E. Case, Ray C. Fair, Sharon E. OsterPublisher:PEARSON
 Engineering Economy (17th Edition)EconomicsISBN:9780134870069Author:William G. Sullivan, Elin M. Wicks, C. Patrick KoellingPublisher:PEARSON
 Principles of Economics (MindTap Course List)EconomicsISBN:9781305585126Author:N. Gregory MankiwPublisher:Cengage Learning
 Managerial Economics: A Problem Solving ApproachEconomicsISBN:9781337106665Author:Luke M. Froeb, Brian T. McCann, Michael R. Ward, Mike ShorPublisher:Cengage Learning
 Managerial Economics & Business Strategy (Mcgraw-...EconomicsISBN:9781259290619Author:Michael Baye, Jeff PrincePublisher:McGraw-Hill Education