
Concept explainers
Videos
Who is the king of late night TV? An Internet survey estimates that, when given a choice between David Letterman and Jay Leno, 52% of the population prefers to watch Jay Leno. Three late night TV watchers are randomly selected and asked which of the two talk show hosts they prefer.
- a. Find the
probability distribution for Y, the number of viewers in the sample who prefer Leno. - b. Construct a probability histogram for p(y).
- c. What is the probability that exactly one of the three viewers prefers Leno?
- d. What are the
mean and standard deviation for Y? - e. What is the probability that the number of viewers favoring Leno falls within 2 standard deviations of the mean?
a
Find the probability distribution for Y, the number of viewers in the sample who prefer Leno.
Answer to Problem 15E
The probability distribution for Y, the number of viewers in the sample who prefer Leno is,
| y | 0 | 1 | 2 | 3 |
| 0.1106 | 0.3594 | 0.3894 | 0.1406 |
Explanation of Solution
Calculation:
Define the random variable Y as number of viewers in the sample who prefer Leno is,
. The random variable Y takes values 0, 1, 2 and 3 because three late night TV watchers are selected randomly.
The probability that the population prefers to watch Jay Leno is 0.52, then the probability that the population does not prefers to watch Jay Leno is
The probability for
The probability for
The probability for
The probability for
Hence, the probability distribution for Y, the number of viewers in the sample who prefer Leno is,
| y | 0 | 1 | 2 | 3 |
| 0.1106 | 0.3594 | 0.3894 | 0.1406 |
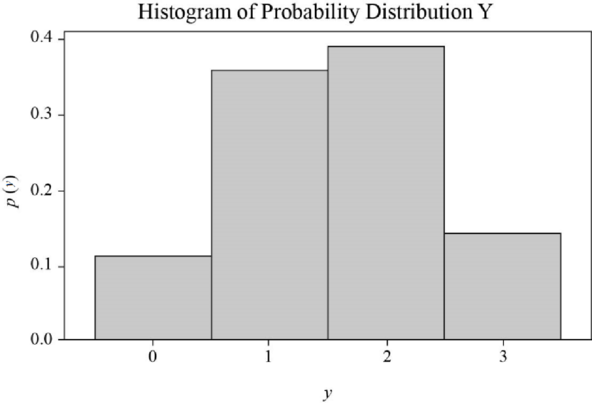
b
Construct a probability histogram for
Answer to Problem 15E
The probability histogram is,
Explanation of Solution
Calculation:
Step by step procedure to construct histogram:
- In histogram, take the values of random variable Y on x-axis.
- Take the values of probability for random variable Y on y-axis.
- Draw a vertical bar corresponding to value 0 in x-axis with the probability value 0.1106.
- Similarly draw vertical bars for all the probability values by taking the bars side-by-side.
c
Find the probability that exactly one of the three viewers prefers Leno.
Answer to Problem 15E
The probability that exactly one of the three viewers prefers Leno is 0.3594.
Explanation of Solution
Calculation:
The probability that exactly one of the three viewers prefers Leno is,
Hence, the probability that exactly one of the three viewers prefers Leno is 0.3594.
d
Find the mean for Y.
Find the standard deviation for Y.
Answer to Problem 15E
The mean for Y is 1.57.
The standard deviation for Y is 0.8471.
Explanation of Solution
Calculation:
Mean:
For a discrete random variable Y and probability function
The mean of random variable Y is,
Hence, the mean for Y is 1.57.
Standard deviation:
For a discrete random variable Y with mean
The standard deviation of random variable Y is,
Hence, the standard deviation for Y is 0.8471.
e
Find the probability that the number of viewers favoring Leno falls within 2 standard deviations of the mean.
Answer to Problem 15E
The probability that the number of viewers favoring Leno falls within 2 standard deviations of the mean is 1.
Explanation of Solution
Calculation:
Substitute 1.57 for
The limits are
Hence, the probability that the number of viewers favoring Leno falls within 2 standard deviations of the mean is 1.
Want to see more full solutions like this?
Chapter 3 Solutions
Mathematical Statistics with Applications


 Calculus For The Life SciencesCalculusISBN:9780321964038Author:GREENWELL, Raymond N., RITCHEY, Nathan P., Lial, Margaret L.Publisher:Pearson Addison Wesley,
 Holt Mcdougal Larson Pre-algebra: Student Edition...AlgebraISBN:9780547587776Author:HOLT MCDOUGALPublisher:HOLT MCDOUGAL