
Videos
Rate of Change Analyses and Ratios Analyses The following are Cohen Company’s comparative financial statements for 2020, 2019, and 2018:
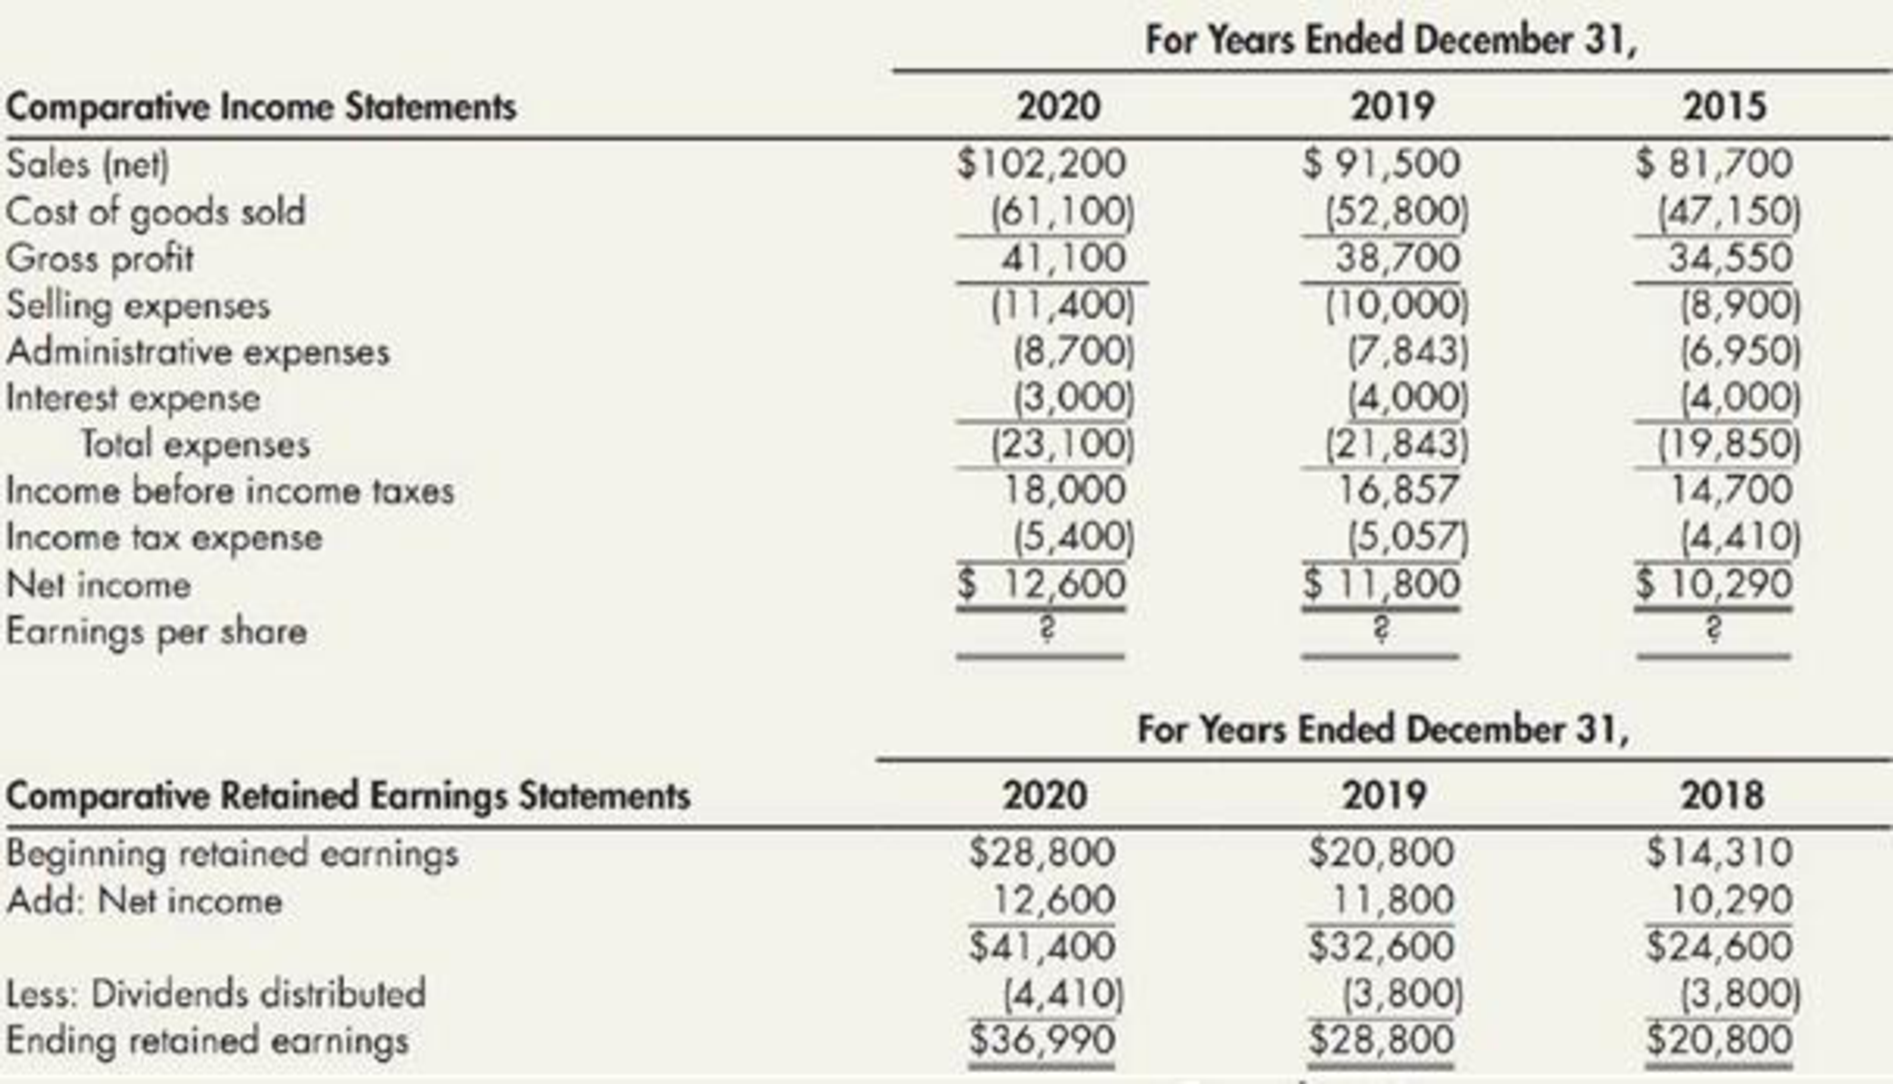
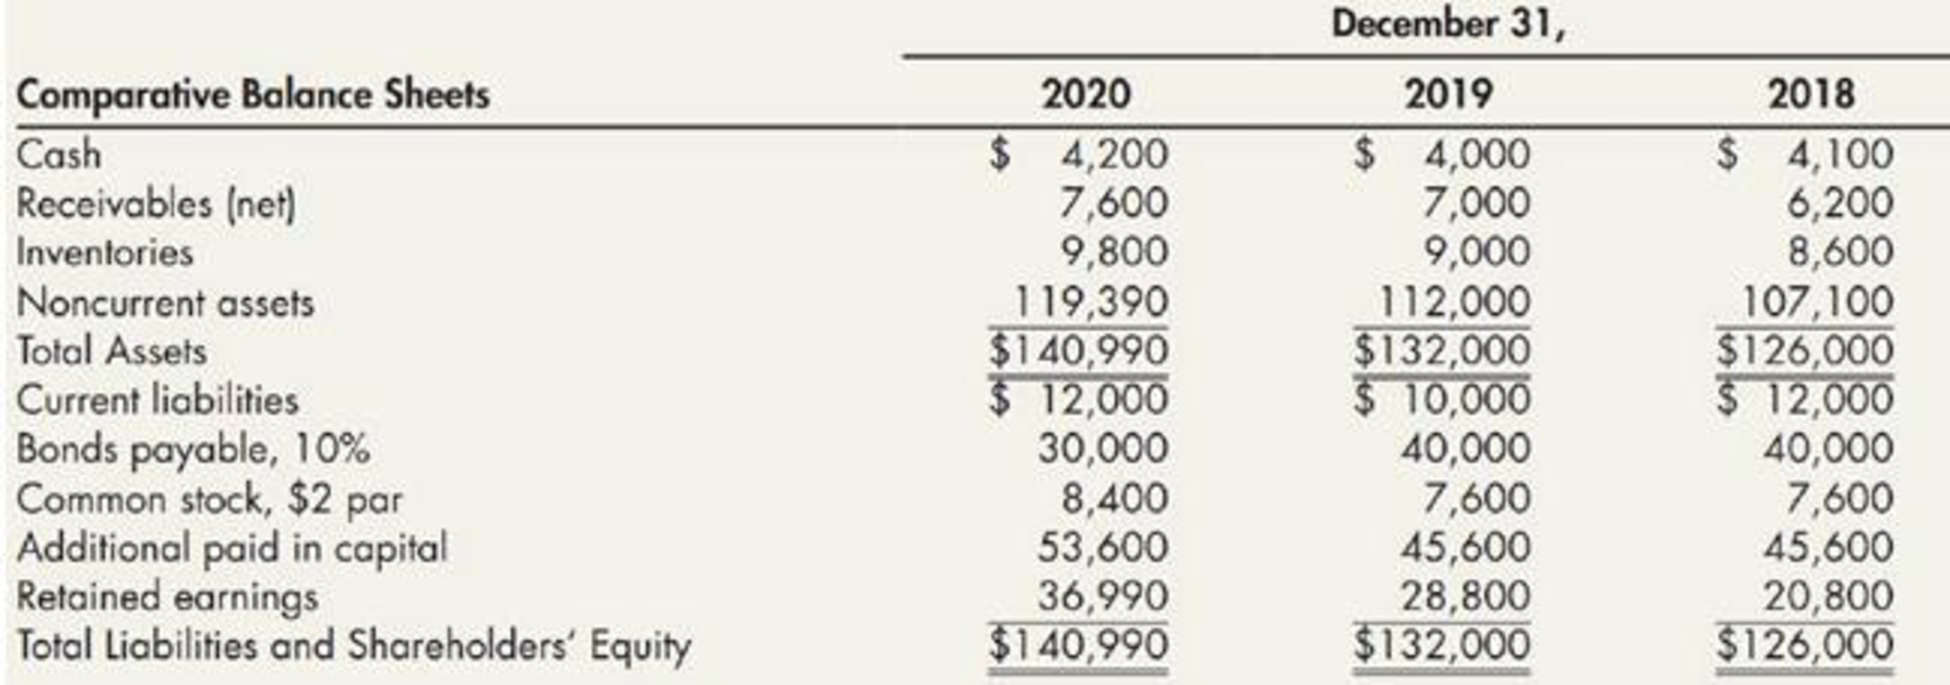
Additional information: Credit sales were 65% of net sales in 2019 and 60% in 2020. At the beginning of 2020, 400 shares of common stock were issued, the first sale of stock in several years.
Cohen is concerned. Although it increased the dividends paid per share by 5% in 2020 and its 2020 net income is higher than 2019 net income, the market price of its common stock dropped from $22 per share at the beginning of 2020 to $21 per share at year-end.
Required:
- 1. For 2019 and 2020, prepare rate of change analyses for the income statements and
balance sheets of Cohen using a year-to-year approach. - 2. For 2019 and 2020, compute the following ratios; (a) current, (b) inventory turnover, (c) receivables turnover, (d) net profit margin, (e) earnings per share, (f) return on total assets, (g) return on shareholders’ equity, and (h) debt-to-assets.
- 3. Next Level Based on your results, discuss the possible reasons for the decrease in the market price per share in 2020.
1.
Prepare rate of change analyses for the income statements and balance sheets of Company C for 2019 and 2020 using the year to year approach.
Explanation of Solution
Balance Sheet: Balance Sheet is one of the financial statements which summarize the assets, the liabilities, and the Shareholder’s equity of a company at a given date. It is also known as the statement of financial status of the business.
Income statement: The financial statement which reports revenues and expenses from business operations and the result of those operations as net income or net loss for a particular time period is referred to as income statement.
Prepare rate of change analyses for the income statements of Company C for 2019 and 2020 using the year to year approach:
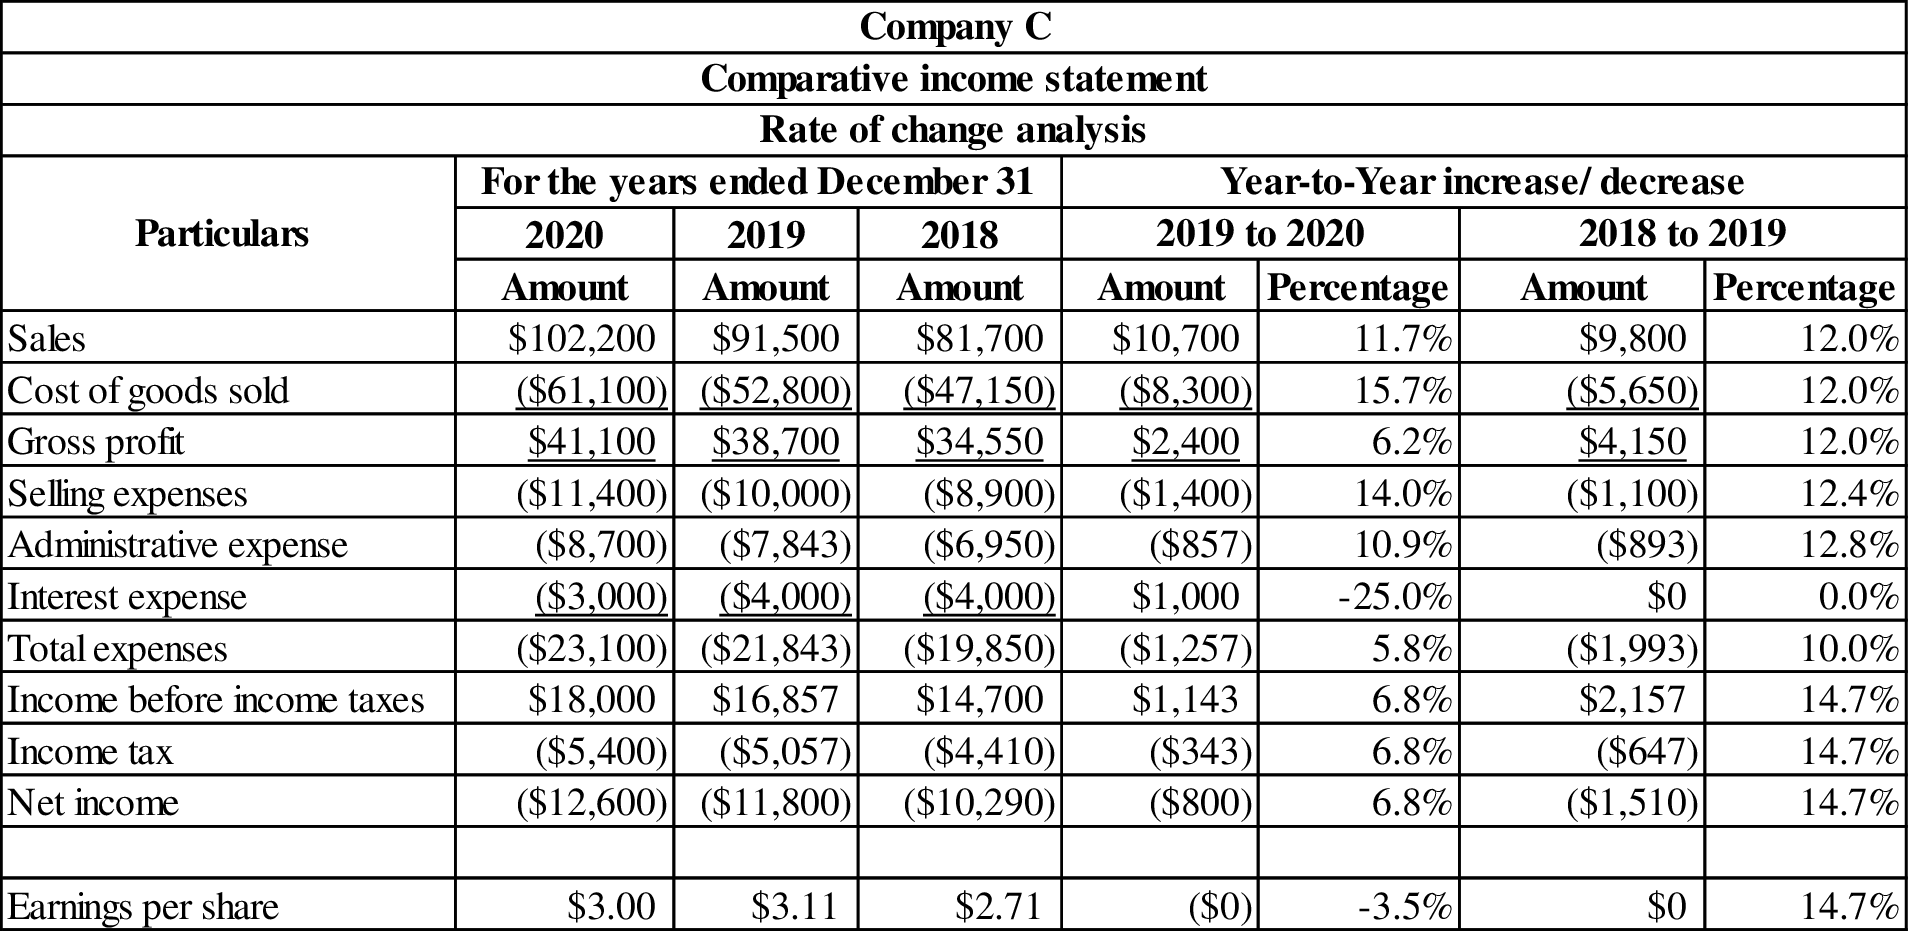
Table (1)
Prepare rate of change analyses for the retained earnings of Company C for 2019 and 2020 using the year to year approach:
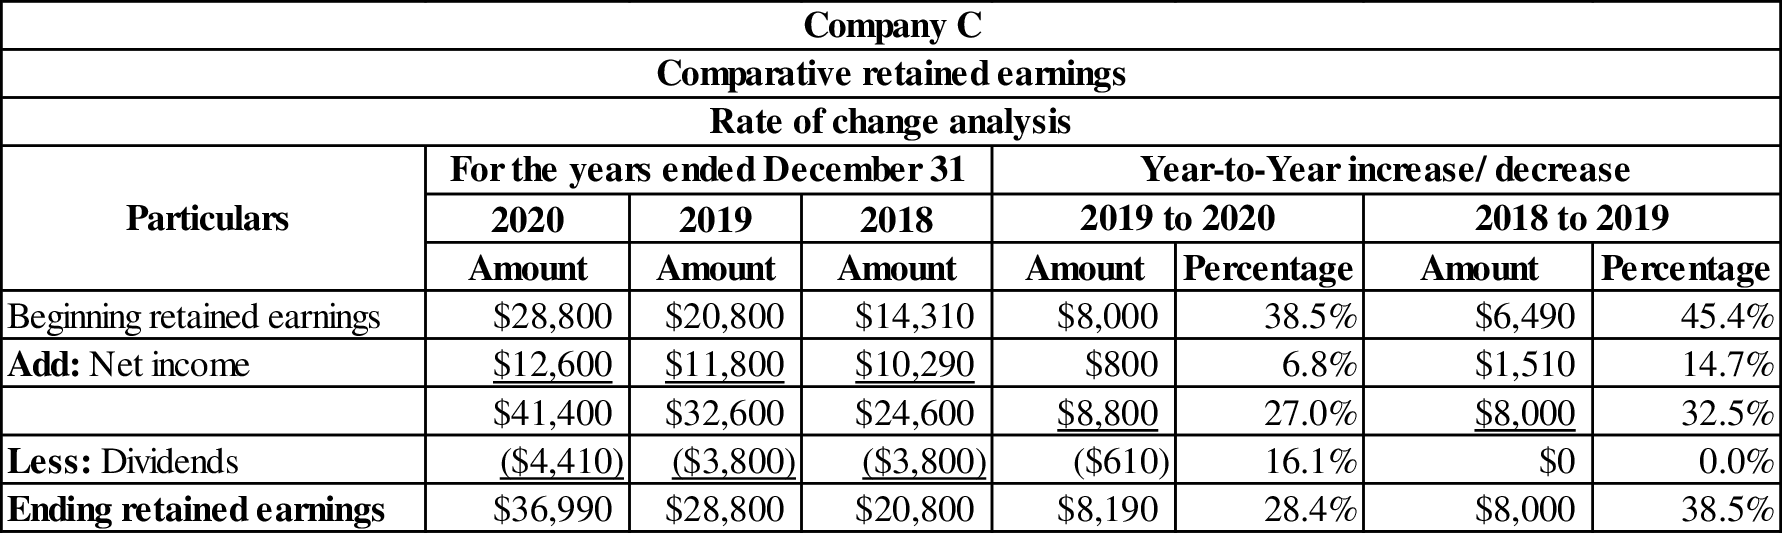
Table (2)
Prepare rate of change analyses for the balance sheets of Company C for 2019 and 2020 using the year to year approach:
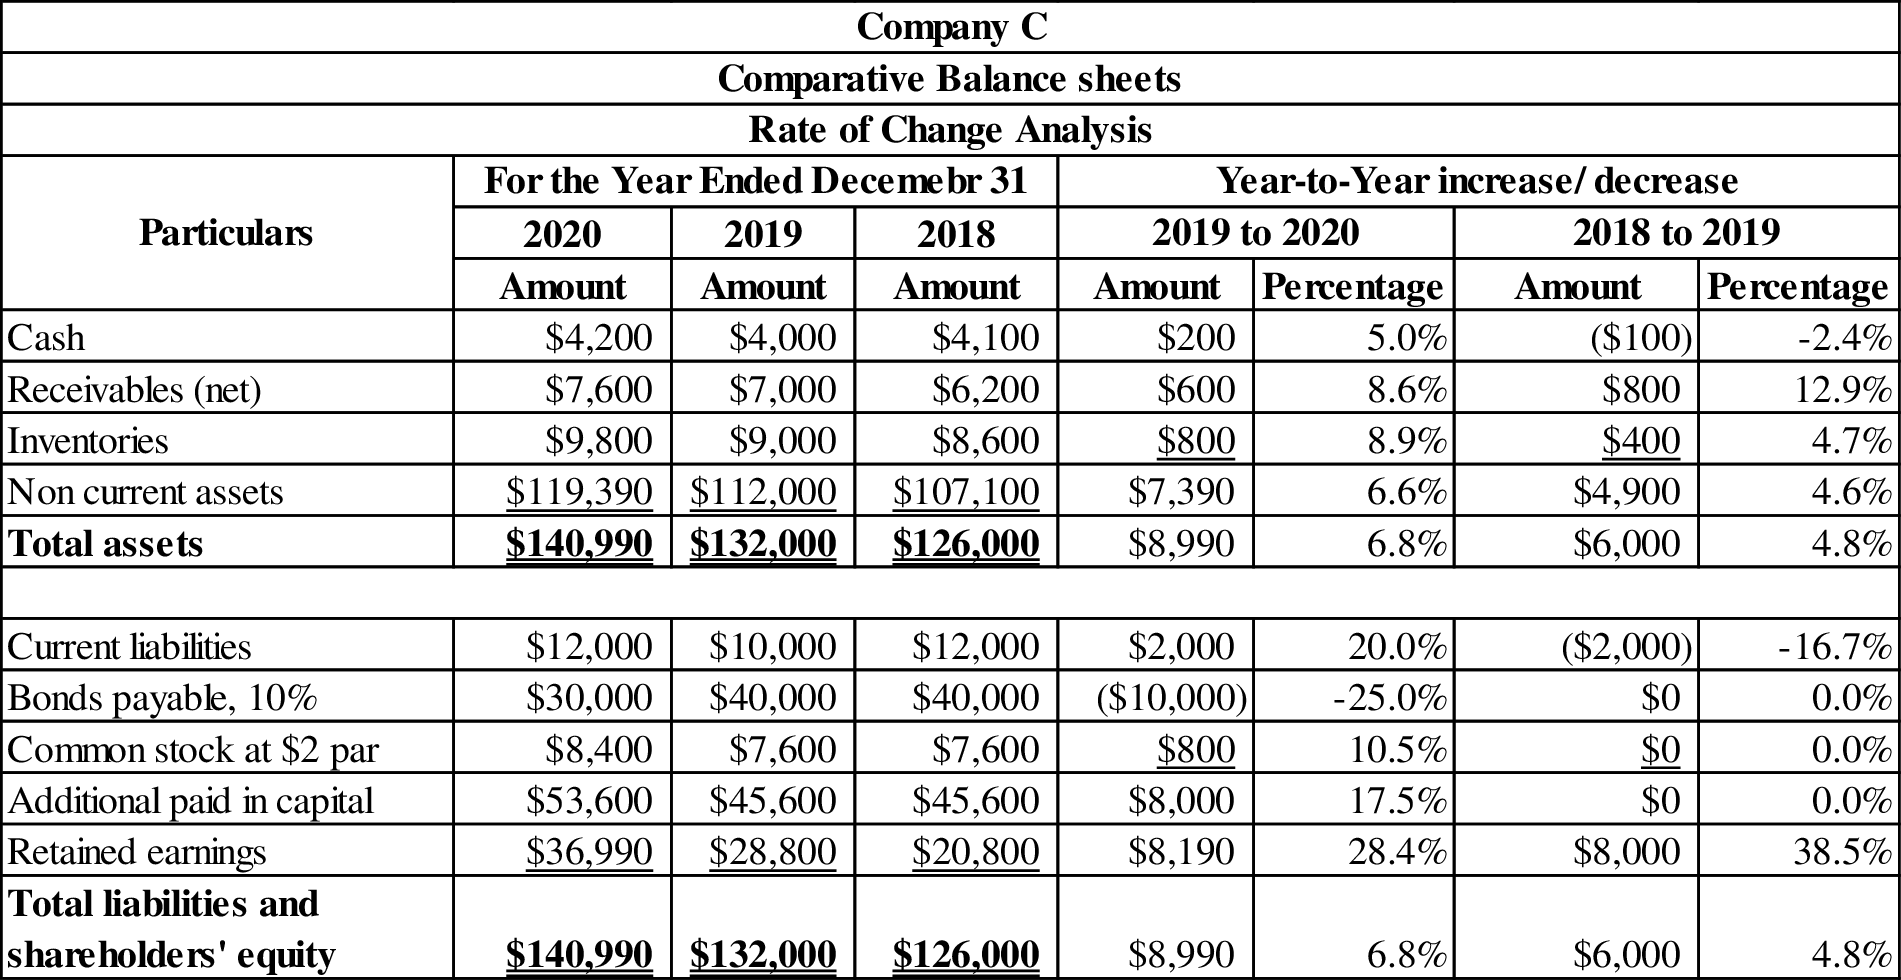
Table (3)
2. (a)
Compute current ratio for 2019 and 2020.
Explanation of Solution
Current ratio: Current ratio is one of the liquidity ratios, which measures the capacity of the company to meet its short-term obligations using its current assets. Current ratio is calculated by using the formula:
Compute current ratio for 2019 and 2020:
| Ratios and Formula | 2020 | 2019 |
|
Current ratio: |
Table (4)
2. (b)
Compute inventory turnover for 2019 and 2020.
Explanation of Solution
Inventory Turnover Ratio: This ratio is a financial metric used by a company to quantify the number of times inventory is used or sold during the accounting period. It is calculated by using the formula:
Compute inventory turnover for 2019 and 2020:
| Ratios and Formula | 2020 | 2019 |
|
Inventory turnover: Average inventory: |
|
|
Table (5)
2. (c)
Compute receivable turnover for 2019 and 2020.
Explanation of Solution
Receivables turnover ratio: Receivables turnover ratio is mainly used to evaluate the collection process efficiency. It helps the company to know the number of times the accounts receivable is collected in a particular time period. This ratio is determined by dividing credit sales and average accounts receivables.
Compute receivable turnover for 2019 and 2020:
| Ratios and Formula | 2020 | 2019 |
|
Receivables turnover: Average accounts receivable: |
|
|
Table (6)
2. (d)
Compute net profit margin for 2019 and 2020.
Explanation of Solution
Net profit margin: It is one of the profitability ratios. Profit margin ratio is used to measure the percentage of net income that is being generated per dollar of revenue or sales.
Compute net profit margin for 2019 and 2020:
| Ratios and Formula | 2020 | 2019 |
|
Net profit margin: |
Table (7)
2. (e)
Compute earnings per share for 2019 and 2020.
Explanation of Solution
Earnings per Share: Earnings per share help to measure the profitability of a company. Earnings per share are the amount of profit that is allocated to each share of outstanding stock.
Compute earnings per share for 2019 and 2020:
| Ratios and Formula | 2020 | 2019 |
|
Earnings per share: |
Table (8)
2. (f)
Compute return on total assets ratio for 2019 and 2020.
Explanation of Solution
Return on total assets: Return on investments (assets) is the financial ratio which determines the amount of net income earned by the business with the use of total assets owned by it. It indicates the magnitude of the company’s earnings with relative to its total assets. Return on investment is calculated as follows:
Compute return on total assets for 2019 and 2020:
| Ratios and Formula | 2020 | 2019 |
|
Return on total assets: Average total assets: |
|
|
Table (9)
Working note: 1 Determine the after tax rate:
| Ratios and Formula | 2020 | 2019 |
|
After tax rate: |
Table (10)
2. (g)
Compute return on common stockholders’ equity for 2019 and 2020.
Explanation of Solution
Return on common stockholders’ equity ratio: It is a profitability ratio that measures the profit generating ability of the company from the invested money of the shareholders. The formula to calculate the return on equity is as follows:
Compute return on common stockholders’ equity for 2019 and 2020:
| Ratios and Formula | 2020 | 2019 |
|
Return on common stockholders’ equity: Average stockholders’ equity: |
|
|
Table (11)
2. (h)
Compute debt to assets for 2019 and 2020.
Explanation of Solution
Debt to assets ratio: The debt to asset ratio shows the relationship between total asset and the total liability of the company. Debt ratio reflects the financial strategy of the company. It is used to measure the percentage of company’s assets that are financed by long term debts. Debt to assets ratio is calculated by using the formula:
Compute debt to assets for 2019 and 2020:
| Ratios and Formula | 2020 | 2019 |
|
Debt to assets ratio: |
Table (12)
3.
Explain the possible reasons for the decrease in the market price per share in 2020.
Explanation of Solution
The probable reason for the decrease in the market price per share in 2020:
- The current ratio, receivable turnover ratio, net profit margin ratio, return on total assets, return on shareholders’ equity and earnings per share ratio in year 2020 are less than the result provided in the year of 2019.
- The financial condition of the company is not as strong as it was in 2019 because earnings per share of Company C have decreased from $3.11(2019) to $3 (2020) and the debt to assets ratio has also decreased from 37.9% (2019) to $29.8% (2020).
Want to see more full solutions like this?
Chapter 5 Solutions
Intermediate Accounting: Reporting And Analysis


- The Jimenez Corporation’s forecasted 2020 financial statements follow, along with some industry average ratios. Calculate Jimenez’s 2020 forecasted ratios, compare them with the industry average data, and comment briefly on Jimenez’s projected strengths and weaknesses. Jimenez Corporation: Forecasted Balance Sheet as of December 31, 2020 Jimenez Corporation: Forecasted Income Statement for 2020 Jimenez Corporation: Per Share Data for 2020 Notes: aIndustry average ratios have been stable for the past 4 years. bBased on year-end balance sheet figures. cCalculation is based on a 365-day year.arrow_forwardRatio Analysis Consider the following information taken from the stockholders equity section: How do you interpret the companys payout and profitability performance? Required: 1. Calculate the following for 2020. (Note. Round answers to two decimal places.) 2. CONCEPTUAL CONNECTION Assume 2019 ratios were: and the current year industry averages are: How do you interpret the companys payout and profitability performance?arrow_forwardDIVIDENDS Brooks Sporting Inc. is prepared to report the following 2019 income statement (shown in thousands of dollars). Prior to reporting this income statement, the company wants to determine its annual dividend. The company has 320,000 shares of common stock outstanding, and its stock trades at 37 per share. a. The company had a 25% dividend payout ratio in 2018. If Brooks wants to maintain this payout ratio in 2019, what will be its per-share dividend in 2019? b. If the company maintains this 25% payout ratio, what will be the current dividend yield on the companys stock? c. The company reported net income of 1.35 million in 2018. Assume that the number of shares outstanding has remained constant. What was the companys per-share dividend in 2018? d. As an alternative to maintaining the same dividend payout ratio. Brooks is considering maintaining the same per-share dividend in 2019 that it paid in 2018. If it chooses this policy, what will be the companys dividend payout ratio in 2019? e. Assume that the company is interested in dramatically expanding its operations and that this expansion will require significant amounts of capital. The company would like to avoid transactions costs involved in issuing new equity. Given this scenario, would it make more sense for the company to maintain a constant dividend payout ratio or to maintain the same per-share dividend? Explain.arrow_forward
- Using the Value Line Investment Survey report in Exhibit 11.5, find the following information for Apple. What was the amount of revenues (i.e., sales) generated by the company in 2017? What were the latest annual dividends per share and dividend yield? What is the earnings per share (EPS) projection for 2019? How many shares of common stock were outstanding? What were the book value per share and EPS in 2017? How much long-term debt did the company have in the third quarter of 2018?arrow_forwardBalance Sheet Calculations Cornerstone Development Companys balance sheet information at the end of 2019 and 2020 is provided in random order, as follows: Additional information: At the end of 2019, (a) the amount of long-term liabilities is twice the amount of current liabilities and (b) there are 2,900 shares of common stock outstanding. During 2020, the company (a) issued 100 shares of common stock for 25 per share, (b) earned net income of 20,600, and (c) paid dividends of 1 per share on the common stock outstanding at year-end. Required: Next Level Fill in the blanks lettered (a) through (p). All of the necessary information is provided. (Hint: It is not necessary to calculate your answers in alphabetical order.)arrow_forwardUse Apple’s financial statements to calculate the following ratios and summary measures for fiscal 2020 and 2019 (round to the nearest tenth). Indicate whether the ratio was more favorable in 2020 or 2019. Apple’s stock price was $115 per share on Sept. 30, 2020 and $55 on Sept. 30, 2019. Fiscal 2020 Fiscal 2019 Is the Ratio more favorable in 2020 or 2019? Return on Assetsarrow_forward
- What is the year-over-year revenue change percent? Use the attached financial data to calculate the ratios for 2022. Round to the nearest decimal. Abercrombie & Fitch Co (ANF) Financial Data Revenues Cost of Sales Total Operating Expenses Interest Expense Income Tax Expense Diluted Weighted Shares Outstanding Cash + Equivalents Accounts Receivable Inventories Total Current Assets Total Assets Accounts Payable Total Current Liabilities Total Stockholders' Equity ANF Stock Price = $10.30 Select one O A. 5.3% B. 14.4% C. -1.4% O D. -3.5% 2022 $3,659.3 $1,545.9 $2,026.9 $28.5 $37.8 52.8 $257.3 $108.5 $742.0 $1,220.4 $2,694.0 $322.1 $935.5 $656.1 2021 $3,712.8 $1,400.8 $1,968.9 $34.1 $38.9 62.6 $823.1 $69.1 $525.9 $1,507.8 $2,939.5 $374.8 $1,015.2 $826.1arrow_forwardCalculation and interpretation of ratios. Data for White Star Limited: Net operating profit after tax is $25 million (2018: $38 million). 1. Use the information above to calculate for 2019 and 2018: debt-to-equity ratio return on equity ratio earnings per share ratio.arrow_forwardUse Apple’s financial statements to calculate the following ratios and summary measures for fiscal 2020 and 2019 (round to the nearest tenth). Indicate whether the ratio was more favorable in 2020 or 2019. Apple’s stock price was $115 per share on Sept. 30, 2020 and $55 on Sept. 30, 2019. Fiscal 2020 Fiscal 2019 Is the Ratio more favorable in 2020 or 2019? DAYS RECEIVABLE DAYS INVENTORY RETURN ON ASSETS PROFIT MARGIN % GROSS MARGIN % RETURN ON EQUITY CURRENT RATIO…arrow_forward
- Better Burgers reported the following numbers (in millions) for the years ending February 2021 and 2022. Net income Dividends Total assets Total equity Internal growth rate Sustainable growth rate 2021 Internal growth rate Sustainable growth rate $ 13,620 6,251 What are the internal and sustainable growth rates? Note: Do not round intermediate calculations and enter your answers as a percent rounded to 2 decimal places, e.g., 32.16. 2022 $ 1,457 209 Internal growth rate Sustainable growth rate % % What are the internal and sustainable growth rates using ROE × b and ROA × b and the end of period equity (assets)? Note: Do not round intermediate calculations and enter your answers as a percent rounded to 2 decimal places, e.g., 32.16. 14,868 7,499 % % What are the growth rates if you use the beginning of period equity in this equation? Note: Do not round intermediate calculations and enter your answers as a percent rounded to 2 decimal places, e.g., 32.16. % %arrow_forwardThe following income statement and balance sheets for Virtual Gaming Systems are provided. VIRTUAL GAMING SYSTEMS Income Statement For the year ended December 31, 2021 Net sales Cost of goods sold Gross profit Expenses: Operating expenses. Depreciation expense Loss on sale of land Interest expense Income tax expense Total expenses Net income Assets Current assets: Cash Accounts receivable Inventory Prepaid rent Long-term assets: Investment in bonds $852,000 27,000 7,400 12,000 42,000 $3,006,000 1,944,000 1,062,000 940, 400 $ 121,600 VIRTUAL GAMING SYSTEMS Land Equipment Less: Accumulated depreciation Total assets Liabilities and Stockholders' Equity Current liabilities: Accounts payable Interest payable Income tax payable. Long-term liabilities: Notes payable Stockholders' equity: Common stock Retained earnings Balance Sheets December 31 2021 $180,000 75,000 99,000 11,400 99,000 204,000 264,000 (63,000) $869,400 $ 60,000 4,800 12,000 279,000 294,000 219,600 2020 $138,000 54,000 129,000…arrow_forwardSome recent financial statements for Smolira Golf Corporation follow. Find the following financial ratios for Smolira Golf Corporation (use year-end figures rather than average values where appropriate): (Enter the profitability ratio answers as a percent rounded to 2 decimal places, e.g., 32.16. Round the remaining answers to 2 decimal places, e.g., 32.16.) 1. Long-term Solvency Ratios 2020 2021 Total debt ratio times times Debt-equity ratio times times Equity multiplier times times 2. Times interest earned times Cash coverage ratio times 3. Profitability Ratios Profit margin % Return on Assets % Return on Equity %arrow_forward
- Intermediate Accounting: Reporting And AnalysisAccountingISBN:9781337788281Author:James M. Wahlen, Jefferson P. Jones, Donald PagachPublisher:Cengage Learning

 Fundamentals Of Financial Management, Concise Edi...FinanceISBN:9781337902571Author:Eugene F. Brigham, Joel F. HoustonPublisher:Cengage Learning
  Pfin (with Mindtap, 1 Term Printed Access Card) (...FinanceISBN:9780357033609Author:Randall Billingsley, Lawrence J. Gitman, Michael D. JoehnkPublisher:Cengage Learning
 Managerial Accounting: The Cornerstone of Busines...AccountingISBN:9781337115773Author:Maryanne M. Mowen, Don R. Hansen, Dan L. HeitgerPublisher:Cengage Learning
 Cornerstones of Financial AccountingAccountingISBN:9781337690881Author:Jay Rich, Jeff JonesPublisher:Cengage Learning