
Videos
Lorena likes to play golf. The number of times per year that she plays depends on both the
a. Using the data under D1 and D2, calculate the cross elasticity of Lorena’s demand for golf at all three prices. (To do tins, apply the midpoints approach to the cross
b. Using the data under D2 and D3, calculate the income elasticity of Lorena's demand for golf at all three prices. (To do this, apply the midpoint approach to the income elasticity of demand.) Is the income elasticity the same at all three prices? Is golf an inferior good?
Subpart (a):
Explanation of Solution
In scenario D1, Lorena’s income is $50,000 per year and movies cost $9 each. In scenario D2, Lorena’s income is also $50,000 per year, but the price to watch a movie rises to $11. And in scenario D3, Lorena’s income rises up to $70,000 per year while the movies cost $11.
Cross price elasticity of demand can be calculated by using the midpoint formula:
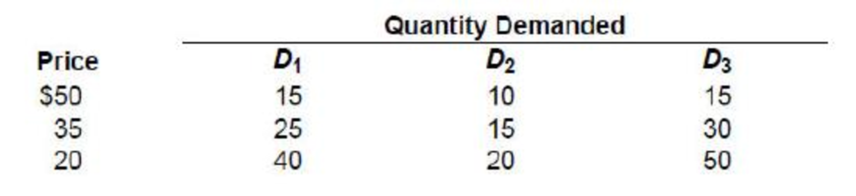
Table -1 shows the demand schedule for the three different goods.
Table -1
| Price | Demand 1 | Demand 2 | Demand 3 |
| 50 | 15 | 10 | 15 |
| 35 | 25 | 15 | 30 |
| 20 | 40 | 20 | 50 |
Substitute the respective values in Equation (1), to calculate the cross elasticity when the demand changes from 15 units to 10 units and the price changes from $9 to $11:
Substitute the respective values in Equation (1), to calculate the cross elasticity When the demand changes from 25 units to 15 units and the price changes from $9 to $11.
Price elasticity is 2.5 (Ignore the sign).
Substitute the respective values in Equation (1), to calculate the cross elasticity when the demand changes from 40 units to 20 units and the price changes from $9 to $11:
Price elasticity is 3.33.
It can be concluded that the cross price elasticities are not same in all three cases (for three different prices). As the price decreases, the percentage change in quantity increases.
In all three cases, the cross price elasticities are negative which indicates that golf and movie are complements. If the price of the movie increases, the quantity of movie falls and the consumption of golf games also decline. This implies that, the consumption of a movie and golf games decline as the price of movies rises and vice versa.
Concept introduction:
Cross price elasticity of demand: The cross price elasticity of demand is the change in the quantity demanded for a good due to the price change in another good. The sign of the coefficients of cross price elasticity of demand tells that whether the good is a complement or substitute. If the cross price elasticity of demand is positive, both goods are substitutes. Two goods are complement to each other if the cross price elasticity of demand is negative.
Income elasticity of demand: The income elasticity of demand is the change in the quantity demand for a good due to the change in income. The sign of the coefficients of income elasticity of demand tells whether the good is normal or inferior. If the income elasticity of demand is positive, the good is considered to be a normal good. The good is an inferior good if the income elasticity of demand is negative.
Subpart (b):
Explanation of Solution
Income elasticity of demand can be calculated by using the midpoint formula:
Substitute the respective values in Equation (2), to calculate the cross elasticity when the quantity changes from 10 units to 15 units and the income changes from $50,000 to $70,000.
Substitute the respective values in Equation (2), to calculate the cross elasticity when the quantity changes from 15 units to 30 units and the income changes from $50,000 to $70,000.
Substitute the respective values in Equation (2), to calculate the cross elasticity when the quantity changes from 20 units to 50 units and the income changes from $50,000 to $70,000, required income elasticity of demand is given by;
In all three cases, the income elasticity of demand is not the same. As the price declines, the change in the quantity demanded becomes more sensitive to the change in income. The demand for the golf games is more sensitive to the income at lower prices.
Here, signs of the coefficients of income elasticity of demand are positive which indicates that, as the income increases, the demand for golf games increases and as income decreases, the demand for the golf game falls. That is the income and the demand for golf is positively related. Thus, the golf game is a considered to be a normal good.
If the demand for a good increases with the decrease in income, the sign of the coefficients of income elasticity of demand is negative and thus the good is an inferior good.
In short, if the sign of the coefficient of income elasticity of demand is positive, the good is a normal good and if it is negative, the good is an inferior good.
The golf game is a normal good and not an inferior good.
Concept introduction:
Cross price elasticity of demand: The cross price elasticity of demand is the change in the quantity demanded for a good due to the price change in another good. The sign of the coefficients of cross price elasticity of demand tells that whether the good is a complement or substitute. If the cross price elasticity of demand is positive, both goods are substitutes. Two goods are complement to each other if the cross price elasticity of demand is negative.
Income elasticity of demand: The income elasticity of demand is the change in the quantity demand for a good due to the change in income. The sign of the coefficients of income elasticity of demand tells whether the good is normal or inferior. If the income elasticity of demand is positive, the good is considered to be a normal good. The good is an inferior good if the income elasticity of demand is negative.
Want to see more full solutions like this?
Chapter 6 Solutions
Economics (Irwin Economics)


- Lorena's income and the cost of other types of entertainment-in particular, how much it costs to go see a movie instead of playing golf. The three demand schedules in the table below show how many rounds of golf per year Lorena will demand at each price under three different scenarios. In scenario D1, Lorena's income is $50,000 per year and movies cost $9 each. In scenario D2, Lorena's income is also $50,000 per year, but the price of seeing a movie rises to $11. And in scenario D3, Lorena's income goes up to $70,000 per year, while movies cost $11. D1 Scenario D2 D3 Income per year $50,000 $50,000 $70,000 Price of movie ticket $9 $11 $11 Quantity Demanded Price of Golf $50 15 10 15 $35 25 15 30 $20 40 20 50 Instructions: Round your answers to 2 decimal places. If you are entering any negative numbers be sure to include a negative sign () in front of those numbers. a. Using the data under Di and D2, calculate the cross elasticity of Lorena's demand for golf at all three prices. (To do…arrow_forwardSuppose that Felix and Janet represent the only two consumers of laundry detergent in some hypothetical market. The following table presents their annual demand schedules for laundry detergent: Price (Dollars per bottle) 2 4 PRICE (Dollars per bottle) 12 10 On the following graph, plot Felix's demand for laundry detergent using the green points (triangle symbol). Next, plot Janet's demand for laundry detergent using the purple points (diamond symbol). Finally, plot the market demand for laundry detergent using the blue points (circle symbol). 2 6 Note: Line segments will automatically connect the points. Remember to plot from left to right. 0 8 10 0 Felix's Quantity Demanded Janet's Quantity Demanded (Bottles) 16 (Bottles) 24 10 16 12 8 4 8 16 6 2 0 24 32 QUANTITY (Bottles) 40 48 A Felix's Demand Janet's Demand Market Demand (?)arrow_forwardLet's say that the demand side of the market for Blue Soda is comprised of 3 leading agents/individuals: Anthony, Brad, and Claire. Let P be the price of 1 liter of Blue Soda, and Qd be the quantity demanded of Blue Soda in liters. Here are the key points to the problem: - Anthony buys only one liter of Blue Soda if the price of it falls below his choke price of $10. - Brad's demand for Blue Soda is defined by QdB = 5 - P/2 - Claire buys 2 liters if the price is below $5, 1 liter if the price is between $5 and $10, and nothing if the price is above $10. Using this information, please sketch the individual demands and the market demand by aggregating the three agents/individuals. Label the graph clearly. Please make sure to sketch the individual demands first and then sketch the market demand.arrow_forward
- Suppose that Felix and Janet represent the only two consumers of iced coffee in some hypothetical market. The following table presents their monthly demand schedules for iced coffee: Price (Dollars per cup) Felix's Quantity Demanded Janet's Quantity Demanded (Cups) (Cups) 1 8 12 2 5 8 3 3 6 4 1 4 5 0 2 On the following graph, plot Felix's demand for iced coffee using the green points (triangle symbol). Next, plot Janet's demand for iced coffee using the purple points (diamond symbol). Finally, plot the market demand for iced coffee using the blue points (circle symbol). Note: Line segments will automatically connect the points. Remember to plot from left to right. PRICE (Dollars per cup) 0 5 6 8 12 QUANTITY (Cups) 16 20 20 24 Felix's Demand Janet's Demand Market Demandarrow_forwardSuppose that Sam and Teresa are the only consumers of scented candles in a particular market. The folloving table shows their annual demand schedules: Price Sam's Quantity Demanded Teresa's Quantity Demanded (Dollars per candle) (Candles) (Candles) 2 16 32 10 24 6. 16 8 2 8. 10 4. On the following graph, plot Sam's demand for scented candles using the green points (triangle symbol). Next, plot Teresa's demand for scented candles using the purple points (diamond symbol). Finally, plot the market demand for scented candles using the blue points (circle symbol). Note: Line segments will automatically connect the points. Remember to plot from left to right. (?) 12 10 Sam's Demand Teresa's Demand Market Demand 24 32 48 QUANTITY (Candles)arrow_forward1. The demand and supply in the market for cheddar cheese (in pounds) is shown in the table below, where Qd0 and Qs0 are the initial quantity demanded and quantity supplied, respectively, for cheddar cheese: Price per Pound $3.00 $3.20 Qdo Qd1 Qs0 Qs1 750 540 700 600 $3.40 $3.60 650 650 620 700 $3.80 $4.00 600 720 590 730 In this space, please illustrate the market for cheddar cheese, with both the supply curve and demand curve graphed on the same graph, making sure you label each component and put the correct variables on the x- and y-axis. The equilibrium price for cheddar cheese is $ and the equilibrium quantity of cheddar cheese produced and a. sold in the market is cartons. b. Now, consider this scenario: The price of milk, a key input for cheese production, rises, so that the quantity supplied for cheddar cheese decreases by 80 pounds at every price. Calculate this new information and add to the Qs1 column in the table above. Then, in the market for cheddar cheese illustrated…arrow_forward
- Suppose that Bob and Cho represent the only two consumers of laundry detergent in some hypothetical market. The following table presents their annual demand schedules for laundry detergent: Price (Dollars per bottle) 2 PRICE (Dollars per bottle) 12 10 0 4 On the following graph, plot Bob's demand for laundry detergent using the green points (triangle symbol). Next, plot Cho's demand for laundry detergent using the purple points (diamond symbol). Finally, plot the market demand for laundry detergent using the blue points (circle symbol). Note: Line segments will automatically connect the points. Remember to plot from left to right. 0 6 8 10 8 Bob's Quantity Demanded Cho's Quantity Demanded (Bottles) (Bottles) 16 32 8 24 4 16 2 8 0 4 16 24 32 QUANTITY (Bottles) 40 48 Bob's Demand Cho's Demand Market Demand (?)arrow_forwardSuppose that you, Julio, and Yusef constitute the market for CDs. Your demand for CDs is illustrated in the graph to the right (D₁), along with Julio's demand (D₂) and Yusef's demand (D3). Using the line drawing tool, construct the market demand curve for CDs. To do this, you will need to use three line segments labeled Dsegment 1, Dsegment 2, and Dsegment 3- Carefully follow the instructions above, and only draw the required objects. Price of CDs 30 D3 28- 26- 24- 22- 20-92 18+ 16- 14- 12- 10-01 8- 6- 4 2- 0- 0 2 4 6 8 10 12 14 16 18 20 22 24 26 28 30 Quantity of CDsarrow_forwardSuppose that you, Jennifer, and Yusef constitute the market for CDs. Your demand for CDs is illustrated in the graph to the right (D₁), along with Jennifer's demand (D₂) and Yusef's demand (D3). Using the line drawing tool, construct the market demand curve for CDs. To do this, you will need to use three line segments labeled Dsegment 1 Dsegment 2, and Dsegment 3. Carefully follow the instructions above, and only draw the required objects. COLLE Price of CDs 307 284 26- 24- 22- 20-0₂ 184 16- 14- 12- 10- 84 64 44 NA 2- 0- 0 2 4 6 8 10 12 14 16 18 20 22 24 26 28 30 Quantity of CDs (0,28) Q OUarrow_forward
- The table below shows two demand schedules for a given style of men’s shoe—that is, how many pairs per month will be demanded at various prices at a men’s clothing store in Seattle called Stromnord. Price D1 Quantity Demanded D2 Quantity Demanded $85 53 13 80 60 15 75 68 18 70 77 22 65 87 27 Suppose that Stromnord has exactly 70 pairs of this style of shoe in inventory at the start of the month of July and will not receive any more pairs of this style until at least August 1. Instructions: Enter your answers as whole numbers.a. If demand is D1, what is the lowest price that Stromnord can charge so that it will not run out of this model of shoe in the month of July? What if demand is D2? b. If the price of shoes is set at $85 for both July and August and demand will be D2 in July and D1 in August, how many pairs of shoes should Stromnord order if it wants to end the month of August with exactly zero pairs of shoes in its inventory? What if the…arrow_forwardSalima is a devoted coca cola consumer, whereas Antonia can drink either coca cola or Pepsi products. Salima's demand for coca cola will be ______, while antonia's demand will be relatively more _______.arrow_forwardConsider the demand for shrimp shown in Figure 2. Suppose the current demand for shrimp is D (in black), the current price of a pound of shrimp is $10, and the current quantity demand of shrimp is 200K. Which of the following correctly describes an increase in the demand for shrimp, assuming the price of a pound of shrimp remains at $10? A) The demand curve for shrimp shifts right from D to D' (blue), and the quantity demand for shrimp decreases from 200K pounds to 150K pounds. B) The demand curve for shrimp shifts left from D to D'' (red), and the quantity demand for shrimp decreases from 200K pounds to 150K pounds. C) The demand curve for shrimp shifts right from D to D' (blue), and the quantity demand for shrimp increases from 200K pounds to 270K pounds. D) The demand curve for shrimp shifts left from D to D'' (red), and the quantity demand for shrimp increases from 200K pounds to 270K pounds.arrow_forward

 Principles of Economics (12th Edition)EconomicsISBN:9780134078779Author:Karl E. Case, Ray C. Fair, Sharon E. OsterPublisher:PEARSON
 Engineering Economy (17th Edition)EconomicsISBN:9780134870069Author:William G. Sullivan, Elin M. Wicks, C. Patrick KoellingPublisher:PEARSON
 Principles of Economics (MindTap Course List)EconomicsISBN:9781305585126Author:N. Gregory MankiwPublisher:Cengage Learning
 Managerial Economics: A Problem Solving ApproachEconomicsISBN:9781337106665Author:Luke M. Froeb, Brian T. McCann, Michael R. Ward, Mike ShorPublisher:Cengage Learning
 Managerial Economics & Business Strategy (Mcgraw-...EconomicsISBN:9781259290619Author:Michael Baye, Jeff PrincePublisher:McGraw-Hill Education