
Concept explainers
Videos
Work these exercises. (See Example 4.)
Bulk Shipments Boxed.com is a company that shipsgrocery items in bulk. As the purchasing manager for a start-up, you decide to compare Boxed.com prices with your currentsupplier for an order of Charmin toilet paper (30 count ultrasoft) and Bounty paper towels (12 count double rolls). Matrix A shows the quantities that the production and sales departments need to order, and matrix B shows the prices foreach supplier. (Data from: www.boxed.com.)
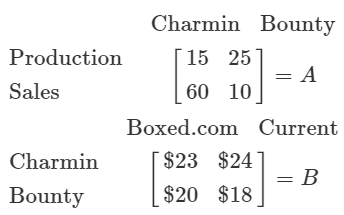
a. Find the matrix product AB.
b. What do the rows of AB represent?
c. What do the columns of AB represent?
d. What would the total cost be (for both departments) if you order from Boxed.com? From your current supplier?
Want to see the full answer?
Check out a sample textbook solution
Chapter 6 Solutions
Mathematics with Applications In the Management, Natural, and Social Sciences (12th Edition)


- Explain the difference between the row-echelon form and the reduced row-echelon form of a matrix.arrow_forwardCan any matrix be written as a system of linear equations? Explain why or why not. Explain how to write that system of equations.arrow_forwardemail: economist.ali1@gmail.com. Q.1 Suppose a simple economy with only an agriculture industry and a steel industry with the following technology matrix. Find the gross production of each industry if surpluses of 15 units of agriculture products and 35 units of steel are desired. A [0.3 0.2] Agrikultura A = 0.1 0.4 Stedarrow_forward
- Determine if the statement is true or false.Different sequences of row operations can lead to different echelon forms for the same matrix.Explain why it is true/false.arrow_forwardCompanies in the U.S. car rental market vary greatly in terms of the size of the fleet, the number of locations, and annual revenue. In 2011, Hertz had 320,000 cars in service and annual revenue of approximately $4.2 billion. Suppose the following data show the number of cars in service (1,000s) and the annual revenue ($ millions) for six smaller car rental companies. Company Cars(1,000s) Revenue($ millions) Company A 11.5 118 Company B 10.0 137 Company C 9.0 102 Company D 5.5 39 Company E 4.2 40 Company F 3.3 32 (a) Develop a scatter diagram with the number of cars in service as the independent variable. A scatter diagram has 6 points plotted on it. The horizontal axis ranges from 0 to 14 and is labeled: Cars in Service (1,000s). The vertical axis ranges from 0 to 160 and is labeled: Annual Revenue ($ millions). The points are plotted from left to right in an upward, diagonal direction starting from the lower left corner of the diagram and are between 3 to 12 on…arrow_forwardCompanies in the U.S. car rental market vary greatly in terms of the size of the fleet, the number of locations, and annual revenue. In 2011, Hertz had 320,000 cars in service and annual revenue of approximately $4.2 billion. Suppose the following data show the number of cars in service (1,000s) and the annual revenue ($ millions) for six smaller car rental companies. Company Cars (1,000s) Revenue ($ millions) Company A 11.5 116 Company B 10 137 Company C 9 102 Company D 5.5 39 Company E 4.2 38 Company F 3.3 30 (a) Develop a scatter diagram with the number of cars in service as the independent variable. (b) What does the scatter diagram developed in part (a) indicate about the relationship between the two variables? (c) Use the least squares method to develop the estimated regression equation that can be used to predict annual revenue (in $ millions) given the number of cars in service (in 1,000s). (Round your numerical values to three decimal…arrow_forward
- Companies in the U.S. car rental market vary greatly in terms of the size of the fleet, the number of locations, and annual revenue. In 2011, Hertz had 320,000 cars in service and annual revenue of approximately $4.2 billion. Suppose the following data show the number of cars in service (1,000s) and the annual revenue ($ millions) for six smaller car rental companies. Company Cars(1,000s) Revenue($ millions) Company A 11.5 118 Company B 10.0 133 Company C 9.0 98 Company D 5.5 37 Company E 4.2 40 Company F 3.3 30 (a) Develop a scatter diagram with the number of cars in service as the independent variable. A scatter diagram has 6 points plotted on it. The horizontal axis ranges from 0 to 14 and is labeled: Cars in Service (1,000s). The vertical axis ranges from 0 to 160 and is labeled: Annual Revenue ($ millions). The points are plotted from left to right in an upward, diagonal direction starting from the lower left corner of the diagram and are between 3 to 12 on…arrow_forwardCompanies in the U.S. car rental market vary greatly in terms of the size of the fleet, the number of locations, and annual revenue. In 2011, Hertz had 320,000 cars in service and annual revenue of approximately $4.2 billion. Suppose the following data show the number of cars in service (1,000s) and the annual revenue ($ millions) for six smaller car rental companies. Company Cars(1,000s) Revenue($ millions) Company A 11.5 116 Company B 10.0 133 Company C 9.0 98 Company D 5.5 37 Company E 4.2 40 Company F 3.3 32 a.Use the least squares method to develop the estimated regression equation that can be used to predict annual revenue (in $ millions) given the number of cars in service (in 1,000s). (Round your numerical values to three decimal places.) b. For every additional car placed in service, estimate how much annual revenue will change (in dollars). (Round your answer to the nearest integer.) Annual revenue will increase by $ , for every additional car placed in…arrow_forwardFormulate the situation in matrix form. Be sure to indicate the meaning of your rows and columns. Find the requested quantities using the appropriate matrix arithmetic. A sports apparel company manufactures shorts, tee shirts, and caps in Costa Rica and Honduras for importation and sale in the United States. In Costa Rica the labor costs per item are 65¢ per pair of shorts, 25¢ per tee shirt, and 45¢ per cap, while the costs of the necessary materials are $1.60 per pair of shorts, 95¢ per tee shirt, and $1.20 per cap. In Honduras the labor costs per item are 85¢ per pair of shorts, 15¢ per tee shirt, and 55¢ per cap, while the costs of the necessary materials are $1.50 per pair of shorts, 75¢ per tee shirt, and $1.10 per cap. Represent these costs as a labor cost matrix L and a materials cost matrix M. Use these matrices to find the total cost matrix C for these products in these countries. (Let the first row represent the cost, in pennies, in Costa Rica and the second row represent…arrow_forward
- Two departments of a firm, A and B, need differing amounts of steel, wood, and plastic. The table on the right gives the amount of each product the departments need. These three products are supplied by two suppliers, Company C and Company D, with the unit prices given in the table on the right. C a. Use matrix multiplication to determine how much these orders will cost each department at each of the two suppliers. Enter the amounts into the cost matrix shown on the right. Dept. A Dept. B Department A Department B Steel Wood Plastic Co. C Company C 580 280 280 Co. D Company D — 570 180 380 Steel 70 60 Wood 60 40 Plastic 40 60arrow_forwardbeauty 4. To help Companies in the U.S. car rental market vary greatly in terms of the size of the fleet, the number of locations, and annual revenue. In 2011, Hertz had 320,000 cars in service and annual revenue of approximately $4.2 billion. The following data show the number of cars in service (1000s) and the annual revenue ($millions) for six smaller car rental companies. Company U-Save Auto Rental System, Inc. Cars (1000s) Revenue ($millions) 111.5 1182 Payless Car Rental System, Inc. 100.0 1353 ACE Rent A Car 93.3 1004 Rent-A-Wreck of America 54.5 373 Triangle Rent-A-Car 47.2 409 Affordable/Sensible 35.3 327 a. Develop a scatter diagram with the number of cars in service as the independent variable. What does the scatter diagram developed in part (a) indicate about the relationship between the two variables? b. Develop and interprete the estimated regression equation C. Does the above data provide a good model fit for the estimate regression equation? 5. According to the…arrow_forwardExplain why the matrix is not in reduced row-echelon form. 1 0 6 4arrow_forward
 Big Ideas Math A Bridge To Success Algebra 1: Stu...AlgebraISBN:9781680331141Author:HOUGHTON MIFFLIN HARCOURTPublisher:Houghton Mifflin Harcourt
 College AlgebraAlgebraISBN:9781305115545Author:James Stewart, Lothar Redlin, Saleem WatsonPublisher:Cengage Learning
 Elementary Linear Algebra (MindTap Course List)AlgebraISBN:9781305658004Author:Ron LarsonPublisher:Cengage Learning
 College Algebra (MindTap Course List)AlgebraISBN:9781305652231Author:R. David Gustafson, Jeff HughesPublisher:Cengage Learning