Videos
Regression Line
Program plan:
- Import the header file.
- Define the “graphWin” method
- Create a window
- Set the coords
- Display the message on the window
- Call the “draw” method for set the point
- Call the “Line” method for draw the line
- Call the “draw” method for set the point
- Call the “Line” method for draw the line
- Call the “draw” method
- Call the “Rectangle” method
- Get the center position
- Set the “Done” text
- Call the “draw” method stop the program after clicking the “Done” text
- Accept the input from the user
- Set the list
- Make the condition true
- Get the mouse action
- Check the condition
- Break the loop
- Otherwise, store user points in an appended list
- Call the “draw” method
- Return the result
- Define the “average” method
- Set the values for the variables
- Iterate “i” until it reaches “allPoints” value
- Get the “x” and “y” value
- Calculate “sumX”, and “sumY”
- Increment the “count” value
- Calculate the “sumXiYi, “sqX”, “sumSqXi”, “SqY”, and sumSqYi” values
- Calculate the “a” and “b” values
- Return the values
- Define “main” method
- Display the text on the window
- Call the “average” method
- Set the values
- Call the “Line” method
- Call the “draw” method
- Get the mouse action
- Call the function “main()”.
Explanation of Solution
Program:
#import the required header files
from graphics import *
import math as m
#definition of "graphWin" method
def graphWin(Title):
#Create a graphics window
win = GraphWin(Title, 400, 400)
#set the coords
win.setCoords(-10, -10, 10, 10)
#tell user to select multiple locations on the screen to designate points
message = Text(Point(-3, 8), "Click to delineate points on the graph.")
#draw the point
message.draw(win)
#call the "Line" method
axisX = Line(Point(-10,0), Point(10,0))
#call the "draw" method
axisX.draw(win)
#call the "Line" method
axisY = Line(Point(0,10), Point(0,-10))
#call the "draw" method
axisY.draw(win)
#call the "Rectangle" method
r = Rectangle(Point(-9, -9), Point(-7,-8))
#call the "draw" method
r.draw(win)
#get the centre position
rCenter = r.getCenter()
#set the text
stopMouse = Text(rCenter, "Done")
#call the "draw" method
stopMouse.draw(win)
#accept input from user until <done> button is pressed
click = Point(0,0)
#set the list
allPoints = []
#check the condition
while True:
#get the mouse action
click = win.getMouse()
#check the condition
if ((-9 <= click.getX() <= -7) and (-9 <= click.getY() <= -8)):
#break the loop
break
#otherwise
else:
#store user points in an appended list
allPoints.append(click)
#call the "draw" method
click.draw(win)
#return the values
return allPoints, win
#definition of "average" method
def average(allPoints):
#set the values for the variables
sumX = 0
sumY = 0
count = 0
sumXiYi = 0
sumSqXi = 0
sumSqYi = 0
#iterate "i" until it reaches "allPoints" value
for i in allPoints:
#get the "x" and "y" value
x = i.getX()
y = i.getY()
#calculate the "sumX" value
sumX = sumX + x
#calculate the "sumY" value
sumY = sumY + y
#increment the value
count = count + 1
#calculate the "xy" value
xy = x * y
#calculate the "sumXiYi" value
sumXiYi = sumXiYi + xy
#calculate the "SqX" value
SqX = x * x
#calculate the "sumSqXi" value
sumSqXi = sumSqXi + SqX
#calculate the "SqY" value
SqY = y * y
#calculate the "sumSqYi" value
sumSqYi = sumSqYi + SqY
#calculate the "a" and "b" value
a = ((sumY * sumSqXi) - (sumX * sumXiYi)) / (count * (sumSqXi) - sumX ** 2)
b = ((count * sumXiYi) - (sumX * sumY)) / (count * (sumSqXi) - sumX ** 2)
#return the values
return a, b
#definition of "main" method
def main():
#get the text for the window
allPoints, win = graphWin("Regression Line")
#call the method
a, b = average(allPoints)
#set the values
x1 = -10
x2 = 10
#call the "Line" method
regressLine = Line(Point(x1, (a + b * x1)), Point(x2, (a + b * x2)))
#call the "draw" method
regressLine.draw(win)
#get the mouse action
win.getMouse()
#call the "main" method
main()
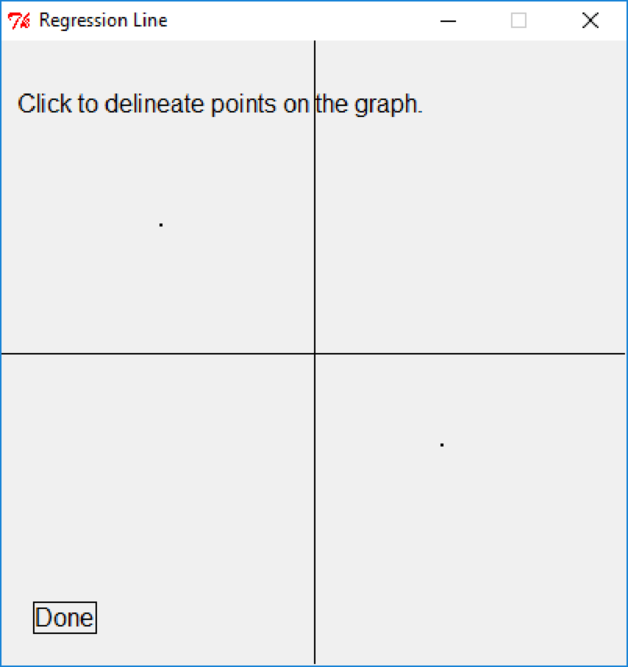
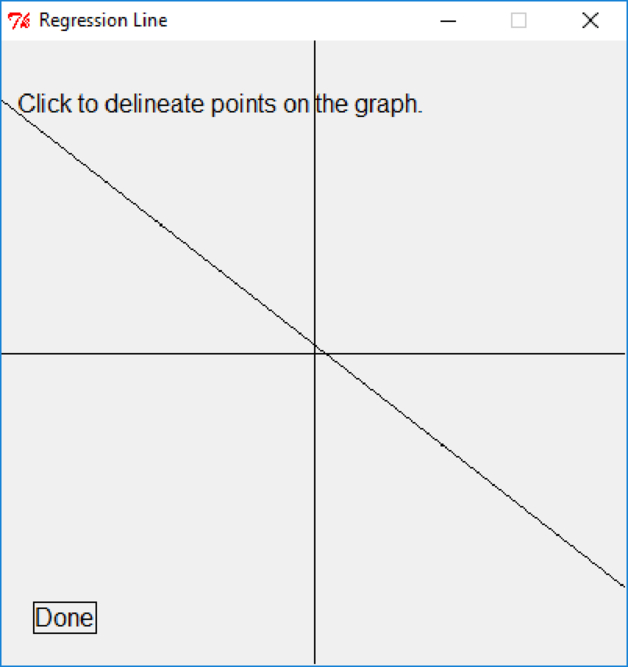
Output:
Screenshot of “Regression Line” window
After clicking “Done” button, the below window will appear
Screenshot of “Regression Line” window
Want to see more full solutions like this?
Chapter 8 Solutions
Python Programming: An Introduction to Computer Science, 3rd Ed.


- A class plays a fishing game in which a large tub is filled with plastic fish that are identical, except that some are red and the rest are white. A student is blindfolded and pulls 10 fish out of the tub. The student removes the blindfold, writes down how many of each color fish she got, and then puts the fish back in the tub. Each student takes a turn. The results are shown in the table. Display these data in a dot plot. Write and answer (to the extent possible) at least three questions about the data display in part (a); include at least one question at each of the three graph-reading levels discussed in the reading.arrow_forwardProgram a simplified Galton board in python. It is required that: The user must select the number of rows n of the board The distribution resulting from dropping the beads should be displayed on the screen. Display an animation where the number of rows n increases over time.All resulting distributions must be scaled to the interval [0, 1], so that it is possible toappreciate the convergence to the normal distribution. Consider n from 1 to 80.arrow_forwardA very known application in natural language processing is to extract information from a given text. In this lab, you will be able to extract some emotions (Sad and Happy) from a given string and calculate the score of each emotion. You will be given below the words that express sadness, anger, and happiness. For each word, you will be given weight as well, so that when you are calculating for example the score for sadness in the text (string), you can use this formula:arrow_forward
- Develop a solution that will calculate the average temperature, given a set of temperatures. The number of temperatures may differ from time to time. (Use a trip values to stop the processing of the loop.) Test the solution with the following 10 temperatures. 78 90 85 80 87 83 75 90 86 70arrow_forwardTentaizu is a classic Japanese game that consists of a 7x7 board of which 10 of those 49 slots are "stars". The objective of the game is to determine the position of these stars. To help with identifying the correct position, some slots contain hints in the form of numbers. These hints work like the number hints in minesweeper in the sense that it identifies how many stars are adjacent to the slot. The range of values are from 0 (no stars) to 8 (fully surrounded by stars). A Tentaizu puzzle contains only these number hints. Much like other puzzle games like sudoku, there is only one combination of star positions that is described by the puzzle. Your task is to create a solver function for a given Tentaizu puzzle using python. This function should be able to recursively solve the puzzle. Define a function "solve" with the input variable being a 7x7 list representing the Tentaizu puzzle. The return value should be a list of tuples containing the correct coordinates of the 10 stars. If…arrow_forwardAssuming that you have the functions "drawPolygon(int[] x, int[] y, int n)" for drawing polygon, "drawRectangle(int x, int y, int width, int height)" for drawing rectangle and "drawCircle(int xc, intyc, int radius)" for drawing circle; draw the given shape. Where: R(300,250), T1(325,275), T2(475,275), T3(400,400), Pı(285.250), P2(225.275), P3(200,450), P4(285, 300), Q1(515,250), Q2(575,275), Q3(600,450), Q4(515,300) C6: (300,75), R=50 C7: (500,75), R=50 C1: (400,150), R=100 С4: (350,150), R-10 C5: (450,150), R=10 C2: (400,195), R=50 C3: (400,175), R=30 C8: (400,225), R=15 P1 R P2, T2 P4 Q2 Q4 T3 Pa 200arrow_forward
- 3. Suppose you have been hired to develop a musical chair game. In this game there will be 7 participants and all of them will be moving clockwise around a set of 7 chairs organized in a circular manner while music will be played in the background. You will control the music using random numbers between 0-3.lf the generated random number is 1, you will stop the music and if the number of participants who are still in the game is n, the participants at position (n/2) will be eliminated. Each time a participant is eliminated, a chair will be removed and you have to print the player names who are still in the game. The game will end when there will be only one participant left. At the end of the game, display the name of the winner. [Hint: You will need to invoke a built-in method to generate a random number between 0 (inclusive) to 3 (inclusive)] Use Python languagearrow_forwardWrite a code for finding circle shape in the image and, let the mouse cursor click on themautomatically (can be used pyautogui library for mouse cursor coordinate).arrow_forwardA square is divided into four smaller regions as shown below in (a). If you throw a dart into the square 1,000,000 times, what is the probability for a dart to fall into an odd-numbered region? Write a program to simulate the process and display the result.arrow_forward
- Write a program that draws line segments using the arrow keys. The line starts from (100, 100) in the pane and draws toward east, north, west, or south when the right-arrow key, uparrow key, leftarrow key, or downarrow key is pressed, as shown in Figure 15.28b.arrow_forwardA robot starts on a point marked “A” on a rectangular grid of points. The starting point is always the top left point on the grid. The robot can move left, right, up or down, moving from one point to the next. By moving in steps going left, right, up or down, the robot would like to reach a point marked “B”, which is always the bottom right point in the grid. Sometimes, points are marked as “x”, and the robot is not allowed to visit them at all. A robot is never allowed to visit a point more than once. In how many ways can the robot move from A to B and visit all points along the way? For example, in the following grid, represented in text as A . . . . B there is only one path from A to B: In the following grid, represented in text as A . . x x B there is still only one path (we're lucky because of the two x's): However, in the grid A . . . x B there are no ways for the robot to move from A to B and visit all points that are not marked with “x”. Write a single…arrow_forwardWrite a program that simulates car racing, as shown in Figure 9.29b–d. The car moves from left to right. When it reaches the right end, it restarts from the left and continues the same process. Let the user increase and decreasethe car’s speed by pressing the Up and Down arrow keys.arrow_forward
 Database System ConceptsComputer ScienceISBN:9780078022159Author:Abraham Silberschatz Professor, Henry F. Korth, S. SudarshanPublisher:McGraw-Hill Education
 Starting Out with Python (4th Edition)Computer ScienceISBN:9780134444321Author:Tony GaddisPublisher:PEARSON
 Digital Fundamentals (11th Edition)Computer ScienceISBN:9780132737968Author:Thomas L. FloydPublisher:PEARSON
 C How to Program (8th Edition)Computer ScienceISBN:9780133976892Author:Paul J. Deitel, Harvey DeitelPublisher:PEARSON
 Database Systems: Design, Implementation, & Manag...Computer ScienceISBN:9781337627900Author:Carlos Coronel, Steven MorrisPublisher:Cengage Learning
 Programmable Logic ControllersComputer ScienceISBN:9780073373843Author:Frank D. PetruzellaPublisher:McGraw-Hill Education