
Principles of Economics 2e
2nd Edition
ISBN: 9781947172364
Author: Steven A. Greenlaw; David Shapiro
Publisher: OpenStax
expand_more
expand_more
format_list_bulleted
Textbook Question
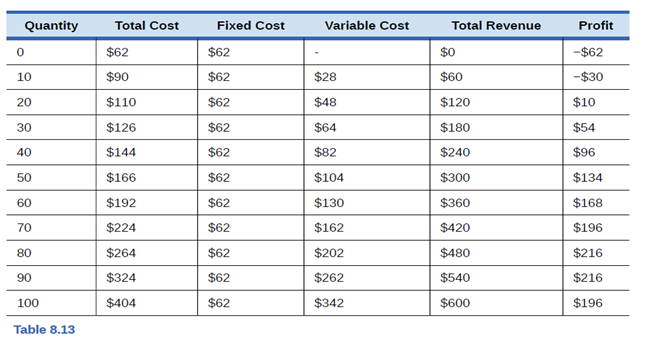
Chapter 8, Problem 3SCQ
Look at Table 8.13. What would happen to the film’s profits if the market
Expert Solution & Answer

Trending nowThis is a popular solution!

Students have asked these similar questions
If Kiesel experienced an increase in orders from its websiteover a period of two weeks, should it expand its productioncapacity to make sure it can handle increased demand inthe future? Why or why not?
What is the profit margin for this firm at a quantity of eight?
Comment on the following statement: “In the short run, Mr. Mohammed, a seller in the Fruit& Vegetable Market in Al-Aweer, faces a demand curve that is simply a horizontalline at themarket equilibrium price. In other words, competitive sellers, in this market, face perfectlyelastic demand in the short run.”
Chapter 8 Solutions
Principles of Economics 2e
Ch. 8 - Firms ill a perfectly competitive market are said...Ch. 8 - Would independent trucking fit the characteristics...Ch. 8 - Look at Table 8.13. What would happen to the films...Ch. 8 - Suppose that the market price increases to 6, as...Ch. 8 - Explain in words why a profit-maximizing film will...Ch. 8 - A firms marginal cost curve above the average...Ch. 8 - If new technology in a perfectly competitive...Ch. 8 - A market in perfect competition is in long-run...Ch. 8 - Productive efficiency and allocative efficiency...Ch. 8 - Explain how the profit-maximizing rule of setting...
Ch. 8 - A single firm in a perfectly competitive market is...Ch. 8 - What are the four basic assumptions of perfect...Ch. 8 - What is a price taker firm?Ch. 8 - How does a perfectly competitive firm decide what...Ch. 8 - What prevents a perfectly competitive firm from...Ch. 8 - How does a perfectly competitive film calculate...Ch. 8 - Briefly explain the reason for the shape of a...Ch. 8 - What two rules does a perfectly competitive firm...Ch. 8 - How does the average cost curve help to show...Ch. 8 - What two lines on a cost curve diagram intersect...Ch. 8 - Should a firm shut down immediately if it is...Ch. 8 - How does the average variable cost curve help a...Ch. 8 - What two lines on a cost curve diagram intersect...Ch. 8 - Why does entry occur?Ch. 8 - Why does exit occur?Ch. 8 - Do entry and exit occur in the short run, the long...Ch. 8 - What price will a perfectly competitive firm end...Ch. 8 - Will a perfectly competitive market display...Ch. 8 - Will a perfectly competitive market display...Ch. 8 - Finding a life partner is a complicated process...Ch. 8 - Can you name five examples of perfectly...Ch. 8 - Your company operates in a perfectly competitive...Ch. 8 - Since a perfectly competitive firm can sell as...Ch. 8 - Many films in the United States file for...Ch. 8 - Why will profits for films in a perfectly...Ch. 8 - Why will losses for firms in a perfectly...Ch. 8 - Assuming that the market for cigarettes is in...Ch. 8 - In the argument for why perfect competition is...Ch. 8 - The AAA Aquarium Co. sells aquariums for 20 each....Ch. 8 - Perfectly competitive firm Doggies Paradise Inc....Ch. 8 - A computer company produces affordable,...
Additional Business Textbook Solutions
Find more solutions based on key concepts
What is the relationship between management by exception and variance analysis?
Horngren's Cost Accounting: A Managerial Emphasis (16th Edition)
What is the best way to control labor costs? What tools are discussed in the chapter that may be used to help c...
Construction Accounting And Financial Management (4th Edition)
Sterlings records show the work in process Inventory had a beginning balance of $4000 and an ending balance of ...
Principles of Accounting Volume 2
Discussion Questions 1. What characteristics of the product or manufacturing process would lead a company to us...
Managerial Accounting (5th Edition)
E6-14 Using accounting vocabulary
Learning Objective 1, 2
Match the accounting terms with the corresponding d...
Horngren's Accounting (12th Edition)
E2-13 Identifying increases and decreases in accounts and normal balances
Learning Objective 2
Insert the mis...
Horngren's Accounting (11th Edition)
Knowledge Booster

Similar questions
- The following graph plots daily cost curves for a firm operating in the competitive market for fitness trackers. Hint: Once you have positioned the rectangle on the graph, select a point to observe its coordinates. PRICE(Dollars pertracker) 100 90 70 60 50 40 20 10 0 0 MO ATC AVC 50 60 70 80 10 20 30 40 QUANTITY (Thousands of trackers per day) 90 100 Profit or Loss In the short run, given a market price equal to $45 per tracker, the firm should produce a daily quantity of trackers. On the preceding graph, use the blue rectangle (circle symbols) to fill in the area that represents profit or loss of the firm given the market price of $45 and the quantity of production from your previous answer. Note: In the following question, enter a positive number regardless of whether the firm earns a profit or incurs a loss. The rectangular area represents a short-run thousand per day for the firm.arrow_forwardWhich of the following will not cause the demand for product K to change?arrow_forwardThis company wants to maximize its profit in the short run. How much is a profit-maximizing quantity and price in the short run? Why? How much is its profit at that profit-maximizing quantity?arrow_forward
- Draw the demand and supply curves and equilibrium points in the decrease in cost of tealeaves, for milk tea.arrow_forwardwhat is the profit maximization for this chart? I know MR must equal MC MR=MC for profit maximization to occur. So how would I solve this problem here? I want to know if this market is profitable.arrow_forwardSuppose you are in charge to analyze the future price trend of a brand. What do you suggest about the price? What should be the change in it in future for market equilibrium if it is currently at P1 and also explain whether there is a surplus or a shortage in this current market?arrow_forward
- The following graph illustrates the weekly demand curve for motorized scooters in Scottsdale. Use the green rectangle (triangle symbols) to compute total revenue at various prices along the demand curve. Note: You will not be graded on any changes made to this graph. PRICE (Dollars per scooter) TOTAL REVENUE (Dollars) 8700 8100 7500 6900 6300 5700 5100 4500 3900 325 3300 300 275 250 225 200 175 150 125 100 75 On the following graph, use the green point (triangle symbol) to plot the weekly total revenue when the market price is $50, $75, $100, $125, $150, $175, and $200 per scooter. (?) 50 25 0 0 10 20 *4 0 25 50 Xo Demand 30 40 50 60 70 80 90 100 110 120 130 QUANTITY (Scooters) Total Revenue 75 100 125 150 175 200 225 250 275 300 325 PRICE (Dollars per scooter) (?) Total Revenue According to the midpoint method, the price elasticity of demand between points A and B is approximatelyarrow_forwardwhat is the profit-maximizing output quantity?arrow_forwardPaulina sells beef in a competitive market where the price is $8 per pound. Her total revenue and total costs are given in the table below. Quantity of Total revenue Total cost beef (lb.) 0 1 2 3 4 ($) 0 8 16 24 32 ($) 4 8 13 19 27 Profit ($) 0 8 pounds Marginal revenue ($) c. What is the profit-maximizing (or loss-minimizing) quantity? Marginal Marginal cost ($) profit ($) a. Complete the table. Instructions: Enter your answers as a whole number. If you are entering any negative numbers be sure to include a negative sign (-) in front of those numbers. b. At what quantity does marginal revenue equal marginal cost? pounds Aarrow_forward
- The blue curve on the following graph represents the demand curve facing a firm that can set its own prices. Use the graph input tool to help you answer the following questions. You will not be scored on any changes you make to this graph. Note: Once you enter a value in a white field, the graph and any corresponding amounts in each grey field will change accordingly. PRICE (Dollars per unit) 100 TOTAL REVENUE (Dollars) 90 80 20 10 0 1250 1125 1000 875 750 625 500 On the previous graph, change the number found in the Quantity Demanded field to determine the prices that correspond to the production of 0, 10, 20, 25, 30, 40, or 50 units of output. Calculate the total revenue for each of these production levels. Then, on the following graph, use the green points (triangle symbol) to plot the results. 375 250 125 + 0 0 0 Demand 5 10 15 20 25 30 35 40 45 50 QUANTITY (Units) + 5 20 10 15 25 30 35 QUANTITY (Number of units) 40 Graph Input Tool Market for Goods 45 50 Quantity Demanded (Units)…arrow_forwardComment on another student's post by suggesting a demand or supply shifter different from the one(s) they suggested that would have the same impact on demand or supply. For example, if a student wrote their post about how demand for the good they are writing about would rise due to a change in one demand shifter, you would respond by explaining how the demand for that good would rise due to a change in a different demand shifter. "A carpet cleaning service has just opened and is increasingly becoming popular, many people have experienced their carpets becoming dirty as the spring season rolls in with heavy rain. Since there has been heavy rain the people in this town have been tracking mud all over their carpets ruining the color and staining it, many people have turn to this carpet cleaner to help remove stains and excess mud out of the carpet. This would cause the demand of the service to shift to the right, increasing the price and moving the equilibrium to the right. The price…arrow_forwardUse the following data to analyze the condition when the product price is set at $56. A. How much would be the total revenue? B. What will be the profit-maximizing or loss-minimizing output? C. How much would be the total cost?arrow_forward
arrow_back_ios
SEE MORE QUESTIONS
arrow_forward_ios
Recommended textbooks for you
 Managerial Economics: Applications, Strategies an...EconomicsISBN:9781305506381Author:James R. McGuigan, R. Charles Moyer, Frederick H.deB. HarrisPublisher:Cengage Learning
 Economics (MindTap Course List)EconomicsISBN:9781337617383Author:Roger A. ArnoldPublisher:Cengage Learning
Managerial Economics: Applications, Strategies an...
Economics
ISBN:9781305506381
Author:James R. McGuigan, R. Charles Moyer, Frederick H.deB. Harris
Publisher:Cengage Learning
Economics (MindTap Course List)
Economics
ISBN:9781337617383
Author:Roger A. Arnold
Publisher:Cengage Learning