
Videos
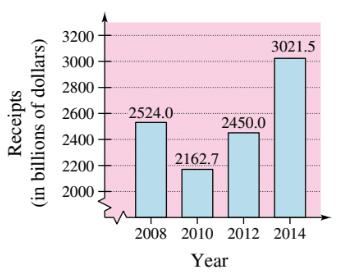
In Exercises 49-52, use the bar graph, which shows the receipts of the federal government (in billions of dollars) for selected years from

Want to see the full answer?
Check out a sample textbook solution
Chapter P Solutions
College Algebra


- In Exercises 49-52, use the bar graph, which shows the receipts of the federal government (in billions of dollars) for selected years from 2008 through 2014. In each exercise, you are given the expenditures of the federal government. Find the magnitude of the surplus or deficit for the year. YearReceipts,RExpenditures,ERE2008$2982.5billionarrow_forwardStock Market The week of September 15, 2008 was one of the most volatile weeks ever for the US stock market. The closing numbers of the Dow Jones Industrial Average each day were: What was the overall change for the week? Was it positive or negative?arrow_forwardUse the data provided in the table.arrow_forward
- The bar graph shows the percentage of U.S.college freshmen with an average grade of A in high school.The data displayed by the bar graph can be described by the mathematical modelwhere x is the number of years after 1980 and p is the percentage of U.S. college freshmen who had an average grade of A in high school. a. According to the formula, in 2000, what percentage of U.S. college freshmen had an average grade of A in high school? Does this underestimate or overestimate the percent displayed by the bar graph? By how much?b. If trends shown by the formula continue, project when 65% of U.S. college freshmen will have had an average grade of A in high school.arrow_forwardWhich phase in a forensic investigation is likely to be most relevant to Excel? Data analysis Data entry Data preparation Data collectionarrow_forwardFind ? Engineering analyzesarrow_forward
- e7.5 please explainarrow_forwardThe bar graph shows the percentage of U.S. college freshmen with an average grade of A in high school.The data displayed by the bar graph can be described by the mathematical modelwhere x is the number of years after 1980 and p is the percentage of U.S. college freshmen who had an average grade of A in high school a. According to the formula, in 2010, what percentage of U.S. college freshmen had an average grade of A in high school? Does this underestimate or overestimate the percent displayed by the bar graph? By how much?b. If trends shown by the formula continue, project when 57% of U.S. college freshmen will have had an average grade of A in high school.arrow_forwardIncreasing? Decreasing? Constant?arrow_forward
 Trigonometry (MindTap Course List)TrigonometryISBN:9781337278461Author:Ron LarsonPublisher:Cengage Learning
 Functions and Change: A Modeling Approach to Coll...AlgebraISBN:9781337111348Author:Bruce Crauder, Benny Evans, Alan NoellPublisher:Cengage Learning
 Elementary AlgebraAlgebraISBN:9780998625713Author:Lynn Marecek, MaryAnne Anthony-SmithPublisher:OpenStax - Rice University
 Glencoe Algebra 1, Student Edition, 9780079039897...AlgebraISBN:9780079039897Author:CarterPublisher:McGraw Hill
 College Algebra (MindTap Course List)AlgebraISBN:9781305652231Author:R. David Gustafson, Jeff HughesPublisher:Cengage Learning