
Concept explainers
Videos
(a)
To calculate: The annual income for a woman with 18 years of education by using degree 2 polynomial and then calculate by how much the median annual income underestimate or overestimate if the bar graph shown below represents the median annual income for Americans by level of education in 2009 and the polynomials models that described the median annual income for men M, for women W who have completed x years of education are,
And the bar graph is,
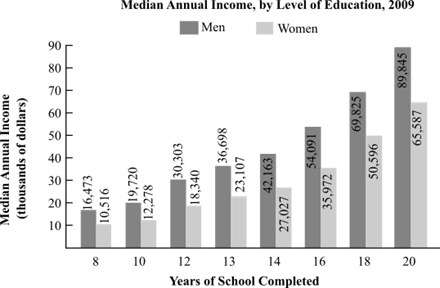
(b)
To calculate: The mathematical model for
(c)
To calculate: The median annual income between men and women with 16 years of education by using part (b) mathematical model
(d)
To calculate: The actual difference in the median annual income between men and women with 16 years of education by using the graph and then calculate by how much the median annual income underestimate or overestimate by the part (c) result of
That is,
Want to see the full answer?
Check out a sample textbook solution
Chapter P Solutions
College Algebra


- How many turning points (from increasing to decreasing or from decreasing to increasing) occurred for the person's heart rate during the 15 minute film? What is the degree of the polynomial function of best fit? Use the graph to estimate the person's maximum heart rate during the 15 minute film. After how many minutes did this maximum heart rate occur? Use the graph to estimate the person's minimum heart rate during the 15 minute film. After how many minutes did this minimum heart rate occur?arrow_forwardIf a house is purchased for $106,000 and is expected to appreciate $900 per year, its value y after x years is given by the polynomial function y = 900x + 106,000. Find the expected value of the house in 10 years. $arrow_forwardExperts fear that without conservation efforts, tigers could disappear from the wild by 2022. Just one hundred years ago, there were at least 100,000 wild tigers. By 2010, the estimated world tiger population was 3200. The bar graph shows the estimated world tiger population for selected years from 1970 through 2010. Also shown is a polynomial function, with its graph, that models the data. a. Find and interpret f(10). Identify this information as a point on the graph of f. b. Does f(10) overestimate or underestimate the actual data shown by the bar graph? By how much? c. Use the Leading Coefficient Test to determine the end behavior to the right for the graph of f. Might this function be useful in modeling the world tiger population if conservation efforts to save wild tigers are successful? Explain your answer.arrow_forward
- What is the relationship between the number of linear factors and the degree of the polynomial?arrow_forwardWrite an equation for the polynomial graphed below 19 y(x) = لمام 7 3456 4 Iarrow_forwardExperts fear that without conservation efforts, tigers could disappear from the wild by 2022. Just one hundred years ago, there were at least 100,000 wild tigers. By 2010, the estimated world tiger population was 3200. The bar graph shows the estimated world tiger population for selected years from 1970 through 2010. Also shown is a polynomial function, with its graph, that models the data. a. Find and interpret f(40). Identify this information as a point on the graph of b. Does f(40) overestimate or underestimate the actual data shown by the bar graph? By how much? c. Use the Leading Coefficient Test to determine the end behavior to the right for the graph of f . Will this function be useful in modeling the world tiger population if conservation efforts to save wild tigers fail? Explain your answer.arrow_forward
- Determine the least possible degree of the polynomial function shown. y -5 -4 -3 -2 -1 1 4 5 -하 2.arrow_forwardWrite an equation for the degree-four polynomial graphed below 5+ 4 3 2- 1 4 3 -2 3 45 -5t y =arrow_forwardFind a polynomial to interpolate the following data: (-1,1),(0,-1) and (1,1).arrow_forward
- 2. Experts fear that tigers could disappear from the wild by 2022. Just one hundred years ago there were at least 100,000 wild tigers. By 2010, the population was 3200. The bar graph shows the estimated world tiger population for selected years from 1970 to 2010. Also shown is a polynomial function with its graph that models the data. Vanishing Tigers Estimated World Tiger Population Graph of a Polynomial Model for the Data sta - 076 - 30. - a2e + 37,01 40,000 35,000 40J00- 37,500 35,000 30,000 25,000 20,000 15,000 28,000 30,000 25,000 F 15,000 10,000 5000 12,500 10,000 5000 6300 3200 1970 1980 1990 2000 2010 10 20 30 40 Year Years after 1970 a) Find and interpret f(40). Identify this information as a point on the graph of f. b) Does f(40) overestimate or underestimate the actual data shown by the bar graph? By how much? c) Using what you know about end behavior, determine the end behavior for the rest of the graph of f. Will this function be useful in modeling the world tiger…arrow_forwardAn equation for a polynomial function whose graph intercepts the horizontal axis at -7, 8, and 15 isarrow_forward

 Glencoe Algebra 1, Student Edition, 9780079039897...AlgebraISBN:9780079039897Author:CarterPublisher:McGraw Hill
 Algebra: Structure And Method, Book 1AlgebraISBN:9780395977224Author:Richard G. Brown, Mary P. Dolciani, Robert H. Sorgenfrey, William L. ColePublisher:McDougal Littell
 College Algebra (MindTap Course List)AlgebraISBN:9781305652231Author:R. David Gustafson, Jeff HughesPublisher:Cengage Learning