
Concept explainers
Videos
Common stocks. The following table shows price-earnings ratios of
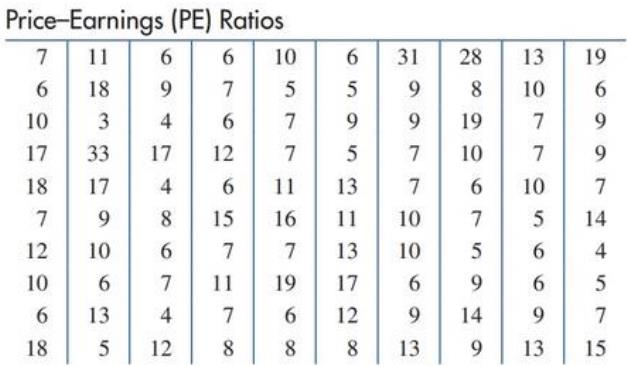
(A) Construct a frequency and relative frequency table using a class interval of
(B) Construct a histogram.
(C) Construct a frequency
(D) Construct a cumulative frequency and relative cumulative frequency table. What is the
probability that a price earnings ratio drawn at random from the sample will fall between
(E) Construct a cumulative frequency polygon.
Want to see the full answer?
Check out a sample textbook solution
Chapter 10 Solutions
Finite Mathematics for Business, Economics, Life Sciences and Social Sciences
Additional Math Textbook Solutions
A Problem Solving Approach To Mathematics For Elementary School Teachers (13th Edition)
Mathematics with Applications In the Management, Natural and Social Sciences (11th Edition)
A Survey of Mathematics with Applications (10th Edition) - Standalone book
Using and Understanding Mathematics: A Quantitative Reasoning Approach (6th Edition)
Finite Mathematics & Its Applications (12th Edition)


 Glencoe Algebra 1, Student Edition, 9780079039897...AlgebraISBN:9780079039897Author:CarterPublisher:McGraw Hill
 Big Ideas Math A Bridge To Success Algebra 1: Stu...AlgebraISBN:9781680331141Author:HOUGHTON MIFFLIN HARCOURTPublisher:Houghton Mifflin Harcourt
 Holt Mcdougal Larson Pre-algebra: Student Edition...AlgebraISBN:9780547587776Author:HOLT MCDOUGALPublisher:HOLT MCDOUGAL