
Videos
Using a global-positioning-system (GPS)-based navigator for your car, you enter a destination and the system will plot a route, give spoken turn-by-turn directions, and show your progress along the route. Today, even budget units include features previously available only on more expensive models. Consumer Reports conducted extensive tests of GPS-based navigators and developed an overall rating based on factors such as ease of use, driver information, display, and battery life. The following data show the price and rating for a sample of 20 GPS units with a 4.3-inch screen that Consumer Reports tested (Consumer Reports website, April 17, 2012).
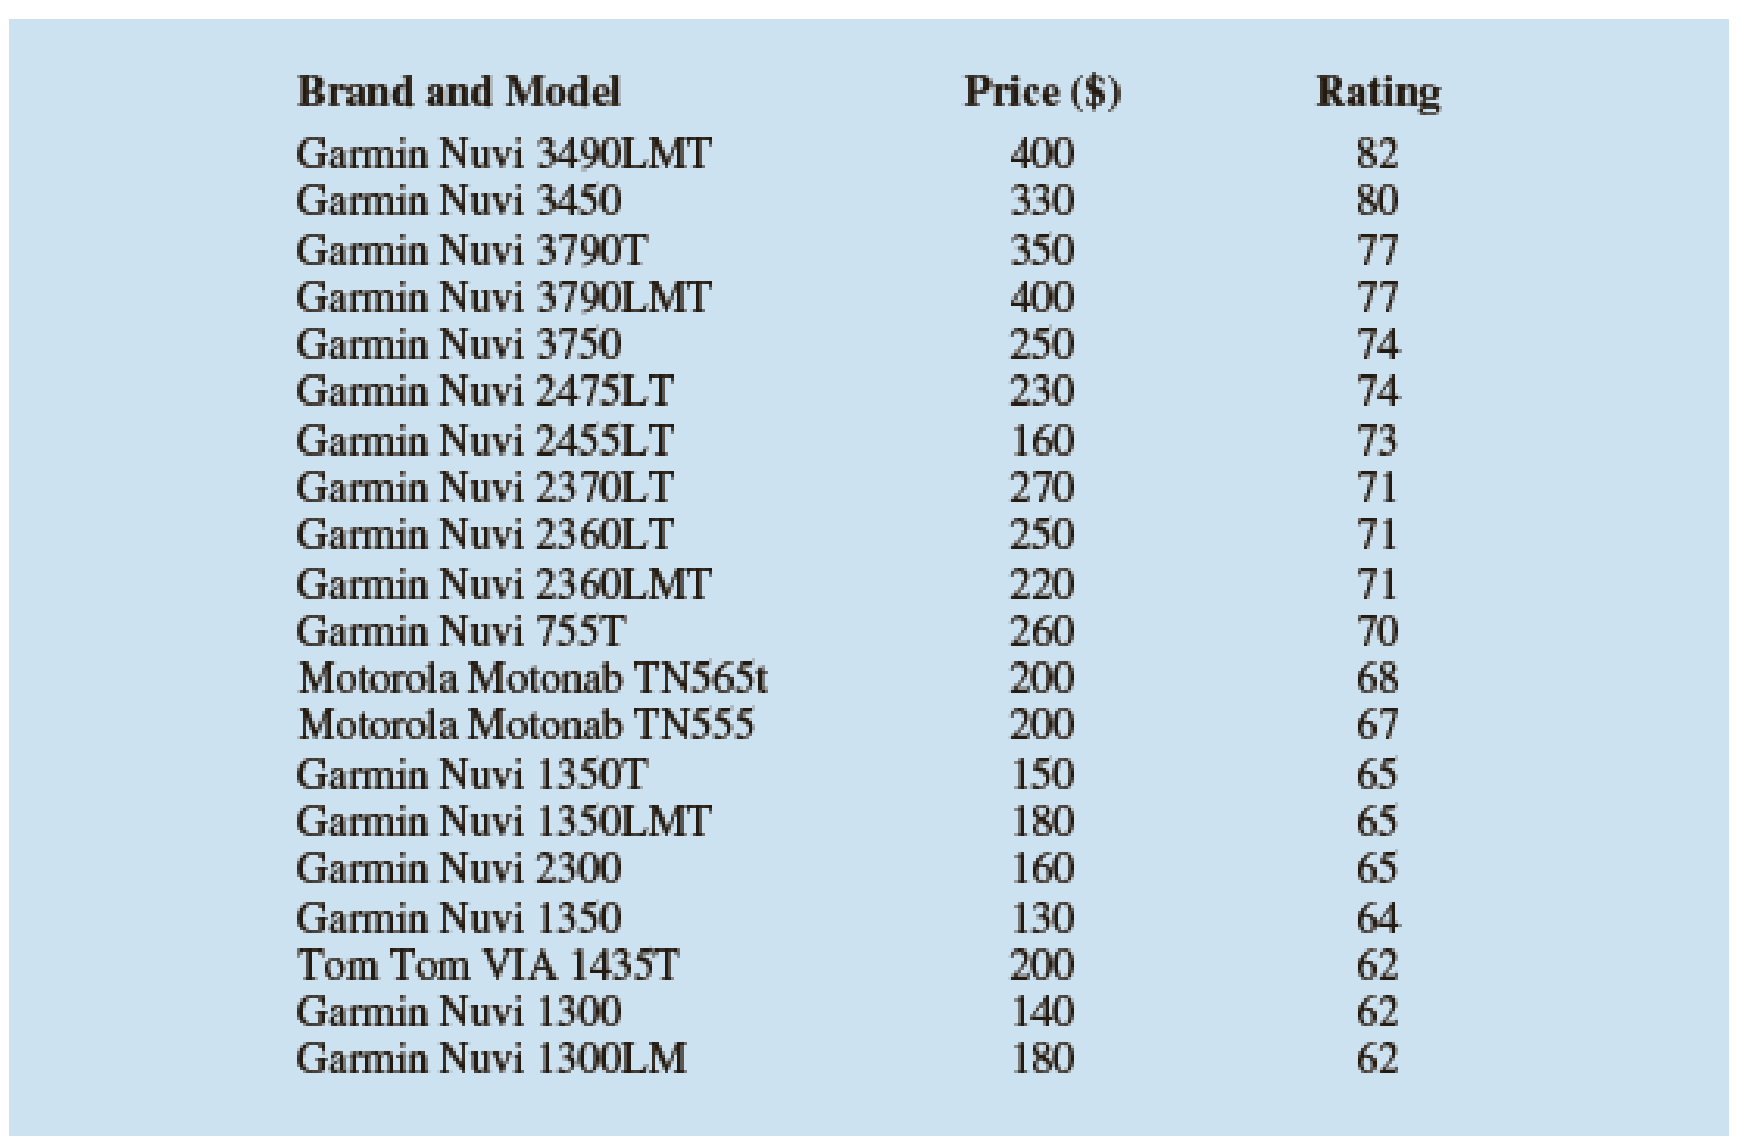
- a. Develop a
scatter diagram with price as the independent variable. - b. What does the scatter diagram developed in part (a) indicate about the relationship between the two variables?
- c. Use the least squares method to develop the estimated regression equation.
- d. Predict the rating for a GPS system with a 4.3-inch screen that has a price of $200.
Want to see the full answer?
Check out a sample textbook solution
Chapter 14 Solutions
Modern Business Statistics with Microsoft Office Excel (with XLSTAT Education Edition Printed Access Card) (MindTap Course List)


- which box plot best represents this data?arrow_forwardThe advertising company creates histograms, shown in Figure 1, forthe podcasts data, but forgets to label them. Which histogramrepresents the data for the podcast from radio station A? Explainyour answer.arrow_forwardWhich type of data source provides real-time data? A. Historical data B. Survey data C. Transactional data D. Social media dataarrow_forward
- Answer questions based on data providedarrow_forwardNo need to answer everything! Just plot the actual visitors and the forecasts. Compare the accuracy of the forecasts in the 1985 to 1990 period with those subsequent to that period.arrow_forwardInterpret the model estimates for age and gender.arrow_forward
- Step 2: Interpret this data.arrow_forwardNeed help with data homework question.arrow_forwardBicycling World, a magazine devoted to cycling, reviews hundreds of bicycles throughout the year. Its "Road-Race" category contains reviews of bicycles used by riders primarily interested in racing. One of the most important factors in selecting a bicycle for racing is the weight of the bicycle. The following data show the weight (pounds) and price ($) for ten racing bicycles reviewed by the magazine. Model Weight Price Fierro 7B 17.9 2200 HX 5000 16.2 6350 Durbin Ultralight 16 8490 Schmidt 16.2 6300 WSilton Advanced 17.5 4100 bicyclette vélo 15.2 8500 Supremo Team 16.5 6200 XTC Racer 17.6 2680 D’Onofrio Pro 17.5 4500 Americana #6 13.6 8200 Use the data to develop an estimated regression equation that could be used to estimate the price for a bicycle given its weight. What is the estimated regression model? Group of answer choices y = -1512x + 30578 y = 1351x + 26327 y = -1161x + 24489 y = -1457x + 27903 y = 1341x + 25176arrow_forward
 Glencoe Algebra 1, Student Edition, 9780079039897...AlgebraISBN:9780079039897Author:CarterPublisher:McGraw Hill
 Holt Mcdougal Larson Pre-algebra: Student Edition...AlgebraISBN:9780547587776Author:HOLT MCDOUGALPublisher:HOLT MCDOUGAL