
Modern Business Statistics with Microsoft Office Excel (with XLSTAT Education Edition Printed Access Card) (MindTap Course List)
6th Edition
ISBN: 9781337115186
Author: David R. Anderson, Dennis J. Sweeney, Thomas A. Williams, Jeffrey D. Camm, James J. Cochran
Publisher: Cengage Learning
expand_more
expand_more
format_list_bulleted
Concept explainers
Videos
Textbook Question
Chapter 14.9, Problem 53E
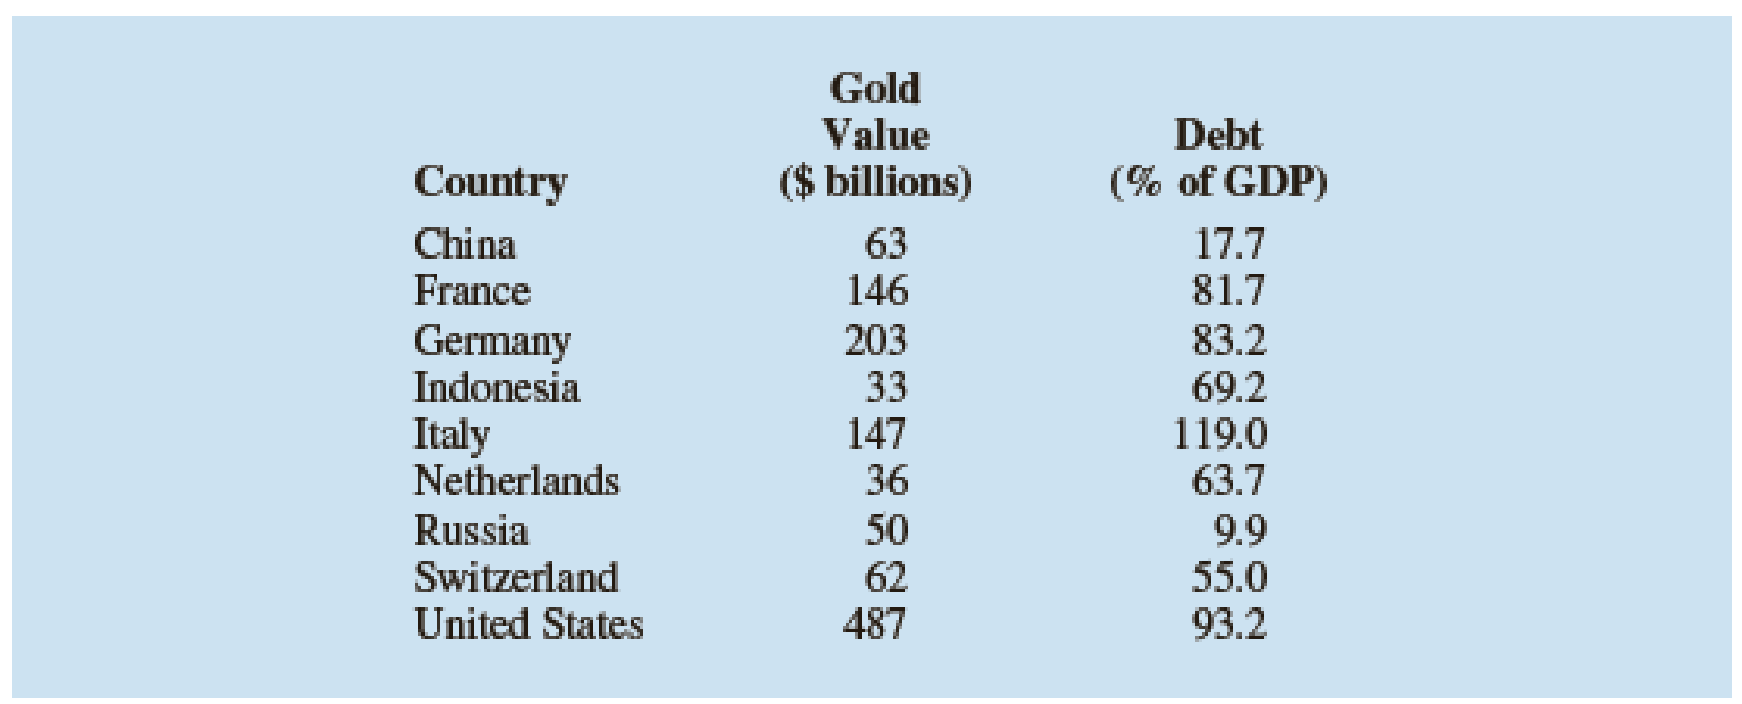
Many countries, especially those in Europe, have significant gold holdings. But many of these countries also have massive debts. The following data show the total value of gold holdings in billions of U.S. dollars and the debt as a percentage of the gross domestic product for nine countries (WordPress and Trading Economics websites, February 24, 2012).
- a. Develop a
scatter diagram for the total value of a country’s gold holdings ($ billions) as the independent variable. - b. What does the scatter diagram developed in part (a) indicate about the relationship between the two variables? Does there appear to be any outliers and/or influential observations? Explain.
- c. Using the entire data set, develop the estimated regression equation that can be used to predict the debt of a country given the total value of its gold holdings.
- d. Suppose that after looking at the scatter diagram in part (a) that you were able to visually identify what appears to be an influential observation. Drop this observation from the data set and fit an estimated regression equation to the remaining data. Compare the estimated slope for the new estimated regression equation to the estimated slope obtained in part (c). Does this approach confirm the conclusion you reached in part (d)? Explain.
Expert Solution & Answer

Trending nowThis is a popular solution!

Students have asked these similar questions
1. The Refuel Agency determined that college students spent $39.6 billion on food in 2020. Identify the population and the variable in this study.
Many countries, especially those in Europe, have significant gold holdings. But many of these countries also have massive debts. The following data show the total value of gold holdings in billions of U.S. dollars and the debt as a percentage of the gross domestic product for nine countries (WordPress and Trading Economics websites, February 24, 2012). Click on the datafile logo to reference the data.
Country
Gold Value
Debt
China
63
17.7
France
146
81.7
Germany
203
83.2
Indonesia
33
69.2
Italy
147
119
Netherlands
36
63.7
Russia
50
9.9
Switzerland
62
55
U.S.
487
93.2
Using the entire data set, develop the estimated regression equation that can be used to predict the debt of a country given the total value of its gold holdings.
y^ = (to 4 decimals) (to 4 decimals) Gold Value
Suppose that after looking at the scatter diagram in part (a) that you were able to visually identify what appears to be an…
Many countries, especially those in Europe, have significant gold holdings. But, many of these countries also have massive debts. The following data show the total value of gold holdings in billions of U.S. dollars and the debt as a percentage of the gross domestic product for nine countries (WordPress and Trading Economics websites, February 24, 2012).
Country
Gold Value
Debt
China
63
17.7
France
146
81.7
Germany
203
83.2
Indonesia
33
69.2
Italy
147
119
Netherlands
36
63.7
Russia
50
9.9
Switzerland
62
55
U.S.
487
93.2
a. Develop a scatter diagram for the total value of a country’s gold holdings ($ billions) as the independent variable.
b. What does the scatter diagram developed in part (a) indicate about the relationship between the two variables? Do there appear to be any outliers and/or influential observations? Explain.
c. Using the entire data set, develop the estimated regression equation that can be used to predict the debt of a country given the…
Chapter 14 Solutions
Modern Business Statistics with Microsoft Office Excel (with XLSTAT Education Edition Printed Access Card) (MindTap Course List)
Ch. 14.2 - Given are five observations for two variables, x...Ch. 14.2 - Given are five observations for two variables, x...Ch. 14.2 - Given are five observations collected in a...Ch. 14.2 - Retail and Trade: Female Managers. The following...Ch. 14.2 - Production Line Speed and Quality Control. Brawdy...Ch. 14.2 - The National Football League (NFL) records a...Ch. 14.2 - Sales Experience and Performance. A sales manager...Ch. 14.2 - Broker Satisfaction. The American Association of...Ch. 14.2 - Companies in the U.S. car rental market vary...Ch. 14.2 - Age and the Price of Wine. For a particular red...
Ch. 14.2 - Laptop Ratings. To help consumers in purchasing a...Ch. 14.2 - Stock Beta. In June of 2016, Yahoo Finance...Ch. 14.2 - Distance and Absenteeism. A large city hospital...Ch. 14.2 - Using a global-positioning-system (GPS)-based...Ch. 14.3 - 15. The data from exercise 1...Ch. 14.3 - The data from exercise 2 follow.
The estimated...Ch. 14.3 - Prob. 17ECh. 14.3 - Price and Quality of Headphones. The following...Ch. 14.3 - Sales Experience and Sales Performance. In...Ch. 14.3 - Price and Weight of Bicycles. Bicycling, the...Ch. 14.3 - Cost Estimation. An important application of...Ch. 14.3 - 22. Refer to exercise 9, where the following data...Ch. 14.5 - The data from exercise 1 follow.
Compute the mean...Ch. 14.5 - The data from exercise 2 follow.
Compute the mean...Ch. 14.5 - The data from exercise 3 follow.
What is the...Ch. 14.5 - Prob. 26ECh. 14.5 - To identify high-paying jobs for people who do not...Ch. 14.5 - Broker Satisfaction Conclusion. In exercise 8,...Ch. 14.5 - Cost Estimation Conclusion. Refer to exercise 21,...Ch. 14.5 - Significance of Fleet Size on Rental Car Revenue....Ch. 14.5 - Significance of Racing Bike Weight on Price. In...Ch. 14.6 - 32. The data from exercise 1...Ch. 14.6 - 33. The data from exercise 2...Ch. 14.6 - Prob. 34ECh. 14.6 - 35. The following data are the monthly salaries y...Ch. 14.6 - 36. In exercise 7, the data on y = annual sales ($...Ch. 14.6 - In exercise 5, the following data on x = the...Ch. 14.6 - Prob. 38ECh. 14.6 - 39. In exercise 12, the following data on x =...Ch. 14.7 - The commercial division of a real estate firm...Ch. 14.7 - Following is a portion of the regression output...Ch. 14.7 - Prob. 43ECh. 14.7 - Auto Racing Helmet. Automobile racing,...Ch. 14.8 - Prob. 45ECh. 14.8 - Prob. 46ECh. 14.8 - Prob. 47ECh. 14.8 - Prob. 48ECh. 14.8 - Prob. 49ECh. 14.9 - Consider the following data for two variables, x...Ch. 14.9 - Prob. 51ECh. 14.9 - Predicting Charity Expenses. Charity Navigator is...Ch. 14.9 - Many countries, especially those in Europe, have...Ch. 14.9 - Valuation of a Major League Baseball Team. The...Ch. 14 - The Dow Jones Industrial Average (DJIA) and the...Ch. 14 - Home Sire and Price. Is the number of square feet...Ch. 14 - Online Education. One of the biggest changes in...Ch. 14 - Machine Maintenance. Jensen Tire & Auto is in the...Ch. 14 - Bus Maintenance. The regional transit authority...Ch. 14 - Studying and Grades. A marketing professor at...Ch. 14 - Used Car Mileage and Price. The Toyota Camry is...Ch. 14 - One measure of the risk or volatility of an...Ch. 14 - As part of a study on transportation safety, the...Ch. 14 - Consumer Reports tested 166 different...Ch. 14 - When trying to decide what car to buy, real value...Ch. 14 - Buckeye Creek Amusement Park is open from the...
Knowledge Booster


Learn more about
Need a deep-dive on the concept behind this application? Look no further. Learn more about this topic, statistics and related others by exploring similar questions and additional content below.Similar questions
- Many countries, especially those in Europe, have significant gold holdings. But, many of these countries also have massive debts. The following data show the total value of gold holdings in billions of U.S. dollars and the debt as a percentage of the gross domestic product for nine countries (WordPress and Trading Economics websites, February 24, 2012). Country Gold Value Debt China 63 17.7 France 146 81.7 Germany 203 83.2 Indonesia 33 69.2 Italy 147 119 Netherlands 36 63.7 Russia 50 9.9 Switzerland 62 55 U.S. 487 93.2 c. Using the entire data set, develop the estimated regression equation that can be used to predict the debt of a country given the total value of its gold holdings. d. Use residual analysis to determine whether any outliers or influential observations are present. e. Suppose that after looking at the scatter diagram in part (a) that you were able to visually identify what appears to be an influential observation. Drop this observation…arrow_forwardMany countries, especially those in Europe, have significant gold holdings. But many of these countries also have massive debts. The following data show the total value of gold holdings in billions of U.S. dollars and the debt as a percentage of the gross domestic product for nine countries (WordPress and Trading Economics websites, February 24, 2012). Country Gold Value Debt China 63 17.7 France 146 81.7 Germany 203 83.2 Indonesia 33 69.2 Italy 147 119 Netherlands 36 63.7 Russia 50 9.9 Switzerland 62 55 U.S. 487 93.2 Select for the total value of a country's gold holdings ($ billions) as the independent variable in a scatter diagram. Using the entire data set, develop the estimated regression equation that can be used to predict the debt of a country given the total value of its gold holdings. ^y = ___ (to 4 decimals) + ___ ( to 4 decimals). Gold Value Suppose that after looking at the scatter…arrow_forwardMany countries, especially those in Europe, have significant gold holdings. But many of these countries also have massive debts. The following data show the total value of gold holdings in billions of U.S. dollars and the debt as a percentage of the gross domestic product for nine countries (WordPress and Trading Economics websites, February 24, 2012). Country Gold Value Debt China 63 17.7 France 146 81.7 Germany 203 83.2 Indonesia 33 69.2 Italy 147 119 Netherlands 36 63.7 Russia 50 9.9 Switzerland 62 55 U.S. 487 93.2 Suppose that after looking at the scatter diagram in part (a) that you were able to visually identify what appears to be an influential observation. Drop this observation from the data set and fit an estimated regression equation to the remaining data. Y^ =arrow_forward
- Here are the countries with the five highest estimated costs of software piracy: United States ($9.1 billion), China ($8.7 billion), India ($2.7 billion), France ($2.1 billion), United Kingdom ($1.9 billion). Among these five countries, the United States has 37.1% of the cost of piracy. Is it correct to conclude that the United States has 37.1% of the total cost of piracy for all countries? What do these results tell us about the costs of piracy in the other countries not included here?arrow_forwardCharity Navigator is America's leading independent charity evaluator. The following data show the total expenses ($), the percentage of the total budget spent on administrative expenses, the percentage spent on fundraising, and the percentage spent on program expenses for 10 supersized charities (Charity Navigator website). Administrative expenses include overhead, administrative staff and associated costs, and organizational meetings. Fundraising expenses are what a charity spends to raise money, and program expenses are what the charity spends on the programs and services it exists to deliver. The sum of the three percentages does not add to 100% because of rounding. Do not round your intermediate calculations. Total Administrative Fundraising Program Expenses Expenses Expenses Expenses Charity (millions of $) (%) (%) (%) 1 American Red Cross 3350 3.7 3.8 92.0 2 World Vision 1210 3.8 7.8 88.3 3 Smithsonian Institution 1080 23.8 2.3 73.8 4 Food For The Poor 1052 0.7 2.1 96.7 5…arrow_forwardCharity Navigator is America's leading independent charity evaluator. The following data show the total expenses ($), the percentage of the total budget spent on administrative expenses, the percentage spent on fundraising, and the percentage spent on program expenses for 10 supersized charities (Charity Navigator website). Administrative expenses include overhead, administrative staff and associated costs, and organizational meetings. Fundraising expenses are what a charity spends to raise money, and program expenses are what the charity spends on the programs and services it exists to deliver. The sum of the three percentages does not add to 100% because of rounding. Do not round your intermediate calculations. Total Administrative Fundraising Program Expenses Expenses Expenses Expenses Charity (millions of $) (%) (%) (%) 1 American Red Cross 3352 3.9 3.9 92.3 2 World Vision 1205 4.1 7.5 88.3 3 Smithsonian Institution 1082 23.4 2.6 73.9 4 Food For The Poor 1048 0.5 2.3 96.9 5…arrow_forward
- Charity Navigator is America's leading independent charity evaluator. The following data show the total expenses ($), the percentage of the total budget spent on administrative expenses, the percentage spent on fundraising, and the percentage spent on program expenses for 10 supersized charities (Charity Navigator website). Administrative expenses include overhead, administrative staff and associated costs, and organizational meetings. Fundraising expenses are what a charity spends to raise money, and program expenses are what the charity spends on the programs and services it exists to deliver. The sum of the three percentages does not add to 100% because of rounding. Do not round your intermediate calculations. Charity Total Administrative Fundraising Program Expenses Expenses Expenses Expenses (millions of $) (%) Fundraising Program 1 American Red Cross 3352 3.9 3.9 92.2 2 World Vision 1210 3.8 7.8 88.6 3 Smithsonian Institution 1082 23.5 2.6 73.6 4 Food For…arrow_forward18. FILE DOW. The accompanying table shows a portion of the 30 companies that comprise the Dow Jones Industrial Average (DJIA). For each company, the data set lists the year that it joined the DJIA, its industry, and its stock price (in $) as of February 15, 2019. Company 3M (MMM) American Express (AXP) : Year 1976 1982 ⠀ 2018 Industry Health Care Finance ⠀ Health Care Price 208.9 107.4 ⠀ 73.43 Walgreen (WBA) a. What is the measurement scale of the Industry variable? b. What is the measurement scale of the Year variable? What are the strengths of this type of measurement scale? What are its weaknesses? c. What is the measurement scale of the Price variable? What are the strengths of this type of measurement scale?arrow_forwardA recent report stated that in 1990, there were approximately 9.7 million employment opportunities in a Science, Technology, Engineering or Mathematics (STEM) related field. There is a reported 17.3 million positions available in a STEM related field in 2019. What is the relative change in the number of STEM positions available from 1990 to 2019? A. 7.6% B. 56.1% C. 43.9% D. 78.4%arrow_forward
arrow_back_ios
arrow_forward_ios
Recommended textbooks for you
 Glencoe Algebra 1, Student Edition, 9780079039897...AlgebraISBN:9780079039897Author:CarterPublisher:McGraw Hill
 Holt Mcdougal Larson Pre-algebra: Student Edition...AlgebraISBN:9780547587776Author:HOLT MCDOUGALPublisher:HOLT MCDOUGAL
Glencoe Algebra 1, Student Edition, 9780079039897...
Algebra
ISBN:9780079039897
Author:Carter
Publisher:McGraw Hill
Holt Mcdougal Larson Pre-algebra: Student Edition...
Algebra
ISBN:9780547587776
Author:HOLT MCDOUGAL
Publisher:HOLT MCDOUGAL
Use of ALGEBRA in REAL LIFE; Author: Fast and Easy Maths !;https://www.youtube.com/watch?v=9_PbWFpvkDc;License: Standard YouTube License, CC-BY
Compound Interest Formula Explained, Investment, Monthly & Continuously, Word Problems, Algebra; Author: The Organic Chemistry Tutor;https://www.youtube.com/watch?v=P182Abv3fOk;License: Standard YouTube License, CC-BY
Applications of Algebra (Digit, Age, Work, Clock, Mixture and Rate Problems); Author: EngineerProf PH;https://www.youtube.com/watch?v=Y8aJ_wYCS2g;License: Standard YouTube License, CC-BY