
Concept explainers
Videos
When installing a bath faucet, it is important to properly fasten the threaded end of the faucet stem to the water-supply line. The threaded stem dimensions must meet product specifications, otherwise malfunction and leakage may occur. Authors of “Improving the Process Capability of a Boring Operation by the Application of Statistical Techniques” (Intl. J. Sci. Engr. Research, Vol. 3, Issue 5, May 2012) investigated the production process of a particular bath faucet manufactured in India. The article reported the threaded stem diameter (target value being 13 mm) of each faucet in 25 samples of size 4 as shown here: Calculate control limits based on using the sample
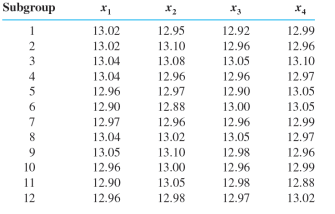
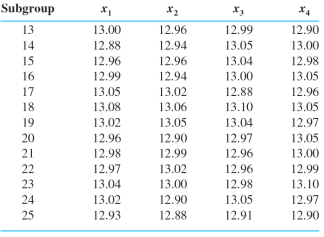
Calculate control limits based on using the sample ranges to estimate σ. Does the process appear to be in control?
Want to see the full answer?
Check out a sample textbook solution
Chapter 16 Solutions
Probability and Statistics for Engineering and the Sciences


- The removal of ammoniacal nitrogen is an important aspect of treatment of leachate at landfill sites. The rate of removal (in percent per day) is recorded for several days for each of several treatment methods. The results are presented in the following table. (Based on the article "Removal of Ammoniacal Nitrogen from Landfill Leachate by Irrigation onto Vegetated Treatment Planes," S. Tyrrel, P. Leeds-Harrison, and K. Harrison, Water Research, 2002:291–299.) Treatment Rate of Removal 5.21 4.65 5.59 2.69 7.57 5.16 6.24 5.94 6.41 6.85 9.18 4.94 4.04 3.29 4.52 3.75 Construct an ANOVA table. You may give a range for the P-value. Can you conclude that the treatment methods differ in their rates of removal? a. b. ABCAEarrow_forwardFoot ulcers are common problem for people with diabetes. Higher skin temperatures on the foot indicate an increased risk of ulcers. The article “An Intelligent Insole for Diabetic Patients with the Loss of Protective Sensation" (Kimberly Anderson, M.S. Thesis, Colorado School of Mines), reports measurements of temperatures, in °F, of both feet for 18 diabetic patients. The results are presented in the Table QI. Table Q1: Measurements of temperatures, in °F of left foot Vs right foot for 18 diabetic patients Left Foot 80 foo Right Foot Right Foot 81 Left Foot (a) berature m80 85 76 85 89 86 9 marks) 75 80 87 82 88 foot temper 86sof 89 would thei 87 ht foo temp 80ures will 78s differ by 278reespredict by 81 (b) 87 82 87 82 I marks) 78 right foot to9erature for 76 tient whose 0 foot tmperature 78 86 85 (c) 88 89 90 88 89 (I marks) (d) Test the slope, ß1 = 1 at 5% level of significance. (e) Calculate the coefficient of correlation r and r² and then interpret their valuesarrow_forwardDetermine the kurtosis if the data given is a sample.arrow_forward
- a) Do these data provide good evidence that increasing the stirring rate causes the yield to increase, within the range of the data? Or might the result be due to confounding? Explain.arrow_forwardFoot ulcers are a common problem for people with diabetes. Higher skin temperatures on the foot indicate an increased risk of ulcers. The article "An Intelligent Insole for Diabetic Patients with the Loss of Protective Sensation" (Kimberly Anderson, M.S. Thesis, Colorado School of Mines), reports measurements of temperatures, in °F, of both feet for 181 diabetic patients. The results are presented in the following table. Left Foot Right Foot 80 80 85 85 75 80 88 86 89 87 87 82 78 78 88 89 89 90 76 81 89 86 87 82 78 78 80 81 87 82 86 85 76 80 88 89 Construct a scatterplot of the right foot temperature (y) versus the left foot temperature (x). Verify that a linear model is appropriate. b. Compute the least-squares line for predicting the right foot temperature from the left foot temperature. If the left foot temperatures of two patients differ by 2 degrees, by how much would you predict their right foot temperatures to differ? Predict the right foot temperature for a patient whose left…arrow_forwardThe article “Approximate Methods for Estimating Hysteretic Energy Demand on PlanAsymmetric Buildings” (M. Rathhore, A. Chowdhury, and S. Ghosh, Journal of Earthquake Engineering, 2011: 99–123) presents a method, based on a modal pushover analysis, of estimating the hysteretic energy demand placed on a structure by an earthquake. A sample of 18 measurements had a mean error of 457.8 kNm with a standard deviation of 317.7 kNm. An engineer claims that the method is unbiased, in other words, that the mean error is 0. Can you conclude that this claim is false?arrow_forward
- Warming and Ice Melt The average depth of the Hudson Bay is 305 feet. Climatologists were interested in seeing if the effects of warming and ice melt were affecting the water level. Fifty-five measurements over a period of weeks yielded a sample mean of 306.2 feet. The population variance is known to be 3.6. Can it be concluded that the average depth has increased with a=.05 ? a)Use the P-value Method b) Use the Critical Value Methodarrow_forwardTo protect against earthquake damage, steel beams are typically fitted and connected with plastic hinges. However, these plastic hinges are prone to deformations and are difficult to inspect and repair. An alternative method of connecting steel beams-one that uses high-strength steel bars with clamps-was investigated. Mathematical models for predicting the performance of these steel connecting bars assume the bars have a mean yield strength of 300 megapascals (MPa). To verify this assumption, the researchers conducted material property tests on the steel connecting bars. In a sample of three tests, the yield strengths were 357, 371, and 361 MPa. Do the data indicate that the true mean yield strength of the steel bars exceeds 300 MPa? Test using a = 0.01. Click the icon to view the Student t-distribution table. O B. Ho: µ#300 Ha:H= 300 O A. Ho:H= 300 Ha: H 300 O D. Ho: H= 300 Ha:H#300 Compute the value of the test statistics. t= 15.13 (Round to two decimal places as needed.) Determine…arrow_forwardMinimization of false trends in measurement caused by extraneous variables can be minimized by: A. Randomizing the order of application of the independent variable. B. Repeated measurement of the dependent variables. C. Signal conditioning and recalibration of the test instrument. D. Neglecting controlled parametrization of fundamental features of the test instrument. E. Getting a new replacement of the test instrument.arrow_forward
- To protect against earthquake damage, steel beams are typically fitted and connected with plastic hinges. However, these plastic hinges are prone to deformations and are difficult to inspect and repair. An alternative method of connecting steel beams-one that uses high-strength steel bars with clamps-was investigated. Mathematical models for predicting the performance of these steel connecting bars assume the bars have a mean yield strength of 300 megapascals (MPa). To verify this assumption, the researchers conducted material property tests on the steel connecting bars. In a sample of three tests, the yield strengths were 357, 371, and 361 MPa. Do the data indicate that the true mean yield strength of the steel bars exceeds 300 MPa? Test using a = 0.01. Click the icon to view the Student t-distribution table. Determine the null and alternative hypotheses. Choose the correct answer below. Ο Α. H0: μ = 300 O B. Ho: H#300 Ha:H 300 O D. Ho: H= 300 Ha:H# 300 Compute the value of the test…arrow_forwardBreast Post- Difference Subject Feeding Weaning = P – B Breast feeding sometimes results in a temporary loss of bone mass as calcium is depleted in the mother's body to provide for milk production. A study by Bezerra et. al in 2004 used a sample of 10 adolescent mothers aged 15-18 who habitually consumed < 500 mg Ca per day, and measure their total body bone mineral content (TBBMC, in grams) both during breast feeding and in the postweaning period". The data are shown on the right. 1 1928 2126 198 2 2549 2885 336 2825 2895 70 4 1924 1942 18 1628 1750 122 2175 2184 7 2114 2164 50 8 2621 2626 a "Bone Mass Is Recovered from Lactation to Postweaning in Adolescent Mothers with Low Calcium Intakes" (American Journal of Clinical Nutrition [2004]: 1322-1326) 9 1843 2006 163 10 2541 2627 86 Mean 2214.8 2320.5 105.7 SD 396.7 406.1 103.8arrow_forwardThe authors of the paper "Statistical Methods for Assessing Agreement Between Two Methods of Clinical Measurement"† compared two different instruments for measuring a person's ability to breathe out air. (This measurement is helpful in diagnosing various lung disorders.) The two instruments considered were a Wright peak flow meter and a mini-Wright peak flow meter. Seventeen people participated in the study, and for each person air flow was measured once using the Wright meter and once using the mini-Wright meter. Subject Mini-WrightMeter WrightMeter Subject Mini-WrightMeter WrightMeter 1 512 494 10 445 433 2 430 395 11 432 417 3 520 516 12 626 656 4 428 434 13 260 267 5 500 476 14 477 478 6 600 557 15 259 178 7 364 413 16 350 423 8 380 442 17 451 427 9 658 650 (a) Suppose that the Wright meter is considered to provide a better measure of air flow, but the mini-Wright meter is easier to transport and to use. If the two types of meters produce different…arrow_forward
 MATLAB: An Introduction with ApplicationsStatisticsISBN:9781119256830Author:Amos GilatPublisher:John Wiley & Sons Inc
 Probability and Statistics for Engineering and th...StatisticsISBN:9781305251809Author:Jay L. DevorePublisher:Cengage Learning
 Statistics for The Behavioral Sciences (MindTap C...StatisticsISBN:9781305504912Author:Frederick J Gravetter, Larry B. WallnauPublisher:Cengage Learning
 Elementary Statistics: Picturing the World (7th E...StatisticsISBN:9780134683416Author:Ron Larson, Betsy FarberPublisher:PEARSON
 The Basic Practice of StatisticsStatisticsISBN:9781319042578Author:David S. Moore, William I. Notz, Michael A. FlignerPublisher:W. H. Freeman
 Introduction to the Practice of StatisticsStatisticsISBN:9781319013387Author:David S. Moore, George P. McCabe, Bruce A. CraigPublisher:W. H. Freeman