
Economics (Irwin Economics)
21st Edition
ISBN: 9781259723223
Author: Campbell R. McConnell, Stanley L. Brue, Sean Masaki Flynn Dr.
Publisher: McGraw-Hill Education
expand_more
expand_more
format_list_bulleted
Question
Chapter 3, Problem 2P
Subparts (a):
To determine
The quantity supplied.
Given information:
Figure 1 shows the Supply curve ‘S1’ for tennis balls:

Table -1 shows the quantity supplied (S1 and S2) and its changes:
‘S1’ Quantity supplied |
‘S2’ Quantity supplied | Change in quantity supplied | |
| 3 | - | 4 | - |
| 2 | - | 2 | - |
| 1 | - | 0 | - |
Subparts (b):
To determine
The quantity supplied.
Given information:
Figure 1 shows the Supply curve ‘S1’ for tennis balls:
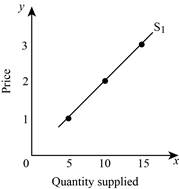
Table -1 shows the quantity supplied (S1 and S2) and its changes:
| Price | ‘S1’ Quantity supplied |
‘S2’ Quantity supplied | Change in quantity supplied |
| 3 | - | 4 | - |
| 2 | - | 2 | - |
| 1 | - | 0 | - |
Subparts (c):
To determine
The quantity supplied.
Given information:
Figure 1 shows the Supply curve ‘S1’ for tennis balls:
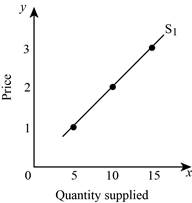
Table -1 shows the quantity supplied (S1 and S2) and its changes:
| Price | ‘S1’ Quantity supplied |
‘S2’ Quantity supplied | Change in quantity supplied |
| 3 | - | 4 | - |
| 2 | - | 2 | - |
| 1 | - | 0 | - |
Subparts (d):
To determine
The quantity supplied.
Given information:
Figure 1 shows the Supply curve ‘S1’ for tennis balls:

Table -1 shows the quantity supplied (S1 and S2) and its changes:
| Price | ‘S1’ Quantity supplied |
‘S2’ Quantity supplied | Change in quantity supplied |
| 3 | - | 4 | - |
| 2 | - | 2 | - |
| 1 | - | 0 | - |
Expert Solution & Answer
Want to see the full answer?
Check out a sample textbook solution
Students have asked these similar questions
Figure 5 below represents two different shifts that occurs in the market for potato chips. All of the shifts go from the curves labeled with a "1" to
curves labeled with a "2". Assume that potato chips are an inferior good. Refer to the figure as you answer the questions that follow.
P
Shift 1
S2
S1
D1
Figure 5
Shift 2
S1
D1
D2
Suppose that the curves in the figure to the right represent two supply curves for
traditional wings (basket of six) at Buffalo Wild Wings.
The movement from point A to B on S, is caused by
S2
S1
O A. a decrease in the price of baskets of traditional wings.
O B. an increase in input prices.
A
O C. an increase in the price of baskets of traditional wings.
Indicate which of the following would cause a movement from point A to C. (Check
all that apply.)
O A. A decrease in worker productivity.
B. An increase in input prices.
O C. A decrease in the number of buyers.
O D. A decrease in the product's price.
Quantity (baskets of traditional wings)
Price (dollars per basket of traditional wings)
3) The following figure shows the demand and supply curves for USB flash drives. D is the demand curve and S1 is
the initial supply curve.
Price (S)
O 10
Quantity (units)
20
40
60
Refer to the figure above and answer the questions:
a) When the demand curve for flash drives is D and the supply curve of flash drives is S1, the equilibrium price is
with an equilibrium quantity ofunits. If the supply curve for flash drives shifts from S1 to S2, with no
change in the demand curve, the new competitive equilibrium price is with a new equilibrium quantity of
units.
b) When the demand curve for flash drives is D and the supply curve of flash drives is S1, what is the surplus in the
market if the price is $7?
O When the demand curve for flash drives is D and the supply curve of flash drives is S1, what is the shortage in the
market if the price is $4?
Chapter 3 Solutions
Economics (Irwin Economics)
Ch. 3.6 - Prob. 1QQCh. 3.6 - Prob. 2QQCh. 3.6 - Prob. 3QQCh. 3.6 - Prob. 4QQCh. 3.A - Prob. 1ADQCh. 3.A - Prob. 2ADQCh. 3.A - Prob. 3ADQCh. 3.A - Prob. 4ADQCh. 3.A - Prob. 5ADQCh. 3.A - Prob. 6ADQ
Ch. 3.A - Prob. 7ADQCh. 3.A - Prob. 1ARQCh. 3.A - Prob. 2ARQCh. 3.A - Prob. 3ARQCh. 3.A - Prob. 4ARQCh. 3.A - Prob. 5ARQCh. 3.A - Prob. 6ARQCh. 3.A - Prob. 1APCh. 3.A - The following table shows two demand schedules for...Ch. 3.A - Prob. 3APCh. 3 - Prob. 1DQCh. 3 - Prob. 2DQCh. 3 - Prob. 3DQCh. 3 - Prob. 4DQCh. 3 - Prob. 5DQCh. 3 - Prob. 6DQCh. 3 - Prob. 7DQCh. 3 - Prob. 8DQCh. 3 - Prob. 1RQCh. 3 - Prob. 2RQCh. 3 - Prob. 3RQCh. 3 - Prob. 4RQCh. 3 - Prob. 5RQCh. 3 - Prob. 6RQCh. 3 - Prob. 7RQCh. 3 - Prob. 8RQCh. 3 - Prob. 9RQCh. 3 - Prob. 1PCh. 3 - Prob. 2PCh. 3 - Prob. 3PCh. 3 - Prob. 4PCh. 3 - Prob. 5PCh. 3 - Prob. 6PCh. 3 - Prob. 7P
Knowledge Booster

Similar questions
- What will happen to the equilibrium price and quantity of traditional camera film if traditional camneras become more expensive, digital cameras become cheaper, the cost of the resources needed to manufacture traditional film falls, and more firms decide to manufacture traditional film? Select one: O a. Quantity will rise, and the effect on price is ambiguous. O b. Price will fall, and the effect on quantity is ambiguous. O c. Quantity will fall, and the effect on price is ambiguous. O d. Price will rise, and the effect on quantity is ambiguous.arrow_forwardIn the market for lawn mowers, if the price of steel, an input used in the production of lawn mowers, rises, and if at the same time homeownership increased which of the following would we expect to occur? Select one: O a. The equilibrium price will rise, and the effect on the equilibrium quantity would be ambiguous. O b. The equilibrium quantity will fall, and the effect on the equilibrium price would be ambiguous. O c. The equilibrium quantity will rise, and the effect on the equilibrium price would be ambiguous. O d. an increase in the equilibrium price and a decrease in equilibrium quantity O e. The equilibrium price will falI, and the effect on the equilibrium quantity would be ambiguous.arrow_forwardNext, complete the following graph, labeled Scenario 2, by shifting the supply and demand curves in the same way that you did on the Scenario 1 graph. PRICE (Dollars per pen) 10 9 8 co LO 5 + 3 2 1 0 0 1 Price Quantity 2 Equilibrium Object True Scenario 2 3 False Supply 4 5 6 7 QUANTITY (Millions of pens) Demand Scenario 1 8 9 Compare both the Scenario 1 and Scenario 2 graphs. Notice that after completing both graphs, you can now see a difference between them that wasn't apparent before the shifts because each graph indicates different magnitudes for the supply and demand shifts in the market for pens. 10 Use the results of your answers on both the Scenario 1 and Scenario 2 graphs to complete the following table. Begin by indicating the overall change in the equilibrium price and quantity after the shift in demand or supply for each shift-magnitude scenario. Then, in the final column, indicate the resulting change in the equilibrium price and quantity when supply and demand shift in…arrow_forward
- In the market for lawn mowers, if the price of steel, an input used in the production of lawn mowers, rises, and if at the same time homeownership increased which of the following would we expect to occur? Select one: O a. The equilibrium price will rise, and the effect on the equilibrium quantity would be ambiguous. O b. The equilibrium quantity will rise, and the effect on the equilibrium price would be ambiguous. O c. The equilibrium price will fall, and the effect on the equilibrium quantity would be ambiguous. O d. an increase in the equilibrium price and a decrease in equilibrium quantity O e. The equilibrium quantity will fall, and the effect on the equilibrium price would be ambiguous. re to search O E E Time left 0:51:32 D W Next pagearrow_forwardThe government offers subsidies to homeowners for the purchase and installation of solar energy generating equipment. Given that silicon (derived from silicate minerals) is the main input in the production of solar panels, how will the subsidy affect the market for silicon? O Supply will rise, leading to an increase in the equilibrium quantity and decrease in price. O Demand will fall, leading to a decrease in the equilibrium price and quantity. O None of the above. O Supply will fall, leading to an increase in the equilibrium price and decrease in the quantity. O Demand will rise, leading to an increase in the equilibrium price and quantity of silicon.arrow_forward3. Refer to the expanded table below from review question 8. LO3.4 a. What is the equilibrium price? At what price is there nei- ther a shortage nor a surplus? Fill in the surplus-shortage column and use it to confirm your answers. b. Graph the demand for wheat and the supply of wheat. Be sure to label the axes of your graph correctly. Label equi- librium price Pand equilibrium quantity Q. c. How big is the surplus or shortage at $3.40? At $4.90? How big a surplus or shortage results if the price is 60 cents higher than the equilibrium price? 30 cents lower than the equilibrium price? Thousands of Bushels Surplus (+) or Shortage (-) Thousands Price per Bushel of Bushels Supplied Demanded 85 $3.40 72 80 3.70 73 75 4.00 75 70 4.30 77 65 4.60 79 60 4.90 81arrow_forward
- Several advertisements announce that the price of hand sanitizer will be decreasing next month. At the same time, the price of rubbing alcohol, an ingredient used to make hand sanitizer has decreased. Given these two effects, what can we say about the current equilibrium price and quantity of hand sanitizer? → a. Equilibrium price will increase, equilibrium quantity will decrease. O b. Equilibrium quantity will decrease; the effect on price is ambiguous. O c. Equilibrium quantity will increase; the effect on price is ambiguous. O d. Equilibrium price will decrease; the effect on quantity is ambiguous.arrow_forwardF4 O % 5 Price 90 85 80 75 70 65 60 55 50 45 40 35 30 25 20 15 10 50 Question 7 (2 points) E 0 5 10 15 20 25 30 35 40 45 50 55 60 65 70 75 80 Quantity If the price were to be $65, then this market is experiencing an ___ in the amount of excess supply, 20 units excess supply; 30 units excess demand, 20 units excess demand; 30 units F5 Market for Laptop Chargers A 6 F6 & 7 F7 * 8 F8 →Demand →→-Supply F9 F10 ins F11 1 1 30°F Pri Searrow_forwardImagine that the curves shown in the accompanying figure represent two demand curves for traditional wings (basket of six) at Buffalo Wild Wings. The movement from point A to B on D, is caused by O A. an increase in the number of buyers. O B. an increase in the price of baskets of traditional wings. C O C. a decrease in the price of baskets of traditional wings. Indicate which of the following could cause a movement from point A to C. (Check all that apply.) D2 O A. A rise in the price of hot sauce. O B. A decline in vegetarianism. O C. Arise in buyer incomes. O D. The expectation of a lower future price for traditional wings. Price (dollars per basket of traditional wings)arrow_forward
- If a household's money income is doubled: Select one: O a. the budget constraint will shift in and parallel to the old one O b. the budget constraint is not affected Oc. the budget constraint will swivel at the Y-intercept O d. the budget constraint will shift out parallel to the old onearrow_forwardConsider the following statement: "The market supply for natural gas is the sum of all prices that natural gas producers are willing and able to sell at for every quantity." What is the flaw in this statement? O It should state that market supply is the sum of the quantities of natural gas that producers are willing and able to sell at every price. O It should state that market supply is the quantity of natural gas that producers are willing and able to sell at one specific price. There is no flaw in this statement. It should state that market supply is the price of natural gas that one firm is willing and able to provide a specified quantity of its product at.arrow_forwardL. At a price of $2.28 per bushel, the supply of barley is 7, 500 million bushels and the demand is 7,900 million bushels. At a price of $2.37 per bushel, the supply of barley is 7,900 million bushels and the demand is 7, 800 million bushels. (A) Find a price-supply equation of the form p ma+ b. (B) Find a price-demand equation of the form p mx+ b. (C) Find the equilibrium point.arrow_forward
arrow_back_ios
SEE MORE QUESTIONS
arrow_forward_ios
Recommended textbooks for you
