
Subpart (a):
Demand and supply.
Subpart (a):
Answer to Problem 4P
Price shifts up and quantity shifts down – a.
Explanation of Solution
When the supply decreases with constant demand curve, it will lead to a decrease in the
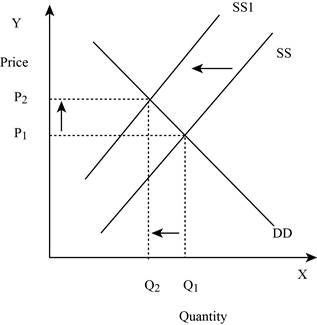
Figure -1
In Figure -1, the horizontal axis measures the quantity supplied and the vertical axis measures the price of the balls. ‘DD’ represents the demand and the demand curve shifts from DD to DD1; ‘SS’ represents the supply curve and the supply curve shifts from SS to SS1. Decrease in supply will lead to a decrease in the equilibrium quantity from ‘Q1 to Q2’ and an increase in the equilibrium price from ‘P1 to P2’.
Concept introduction:
Demand: Demand refers to the total value of the goods and services that are demanded at a particular price in the given period of time.
Supply: Supply refers to the total value of the goods and services that are available for purchase at a particular price in the given period of time.
Subpart (b):
Demand and supply.
Subpart (b):
Answer to Problem 4P
Price shifts down and quantity shifts down – b.
Explanation of Solution
When the demand decreases with constant supply curve, it will lead to a decrease in the equilibrium quantity and equilibrium price. This is shown below in Figure -2:
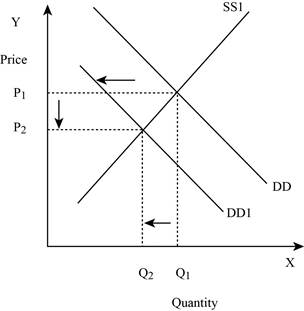
Figure -2
In Figure -2, the horizontal axis measures the quantity supplied and the vertical axis measures the price of the balls. ‘DD’ represents the demand and the demand curve shifts to the left from DD to DD1; ‘SS’ represents the supply curve. Decrease in supply will lead to a decrease in the equilibrium quantity from ‘Q1 to Q2’ and the equilibrium price from ‘P1 to P2’.
Concept introduction:
Demand: Demand refers to the total value of the goods and services that are demanded at a particular price in the given period of time.
Supply: Supply refers to the total value of the goods and services that are available for purchase at a particular price in the given period of time.
Subpart (c):
Demand and supply.
Subpart (c):
Answer to Problem 4P
Price shifts down and quantity shifts up – c.
Explanation of Solution
When the demand is constant with an increase in the supply curve, it will lead to a decrease in the equilibrium price and an increase in the equilibrium quantity. This is shown below in Figure -3:
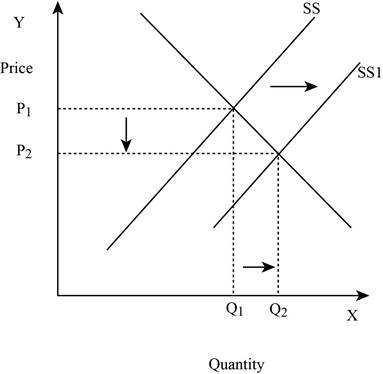
Figure -3
In Figure -3, the horizontal axis measures the quantity supplied and the vertical axis measures the price of the balls. ‘DD’ represents the demand and ‘SS’ represents the supply curve and the supply curve shifts to the right from SS to SS1. Increase in supply will lead to a decrease in the equilibrium price from ‘P1 to P2’ and an increase in the equilibrium quantity from ‘Q1 to Q2’.
Concept introduction:
Demand: Demand refers to the total value of the goods and services that are demanded at a particular price in the given period of time.
Supply: Supply refers to the total value of the goods and services that are available for purchase at a particular price in the given period of time.
Subpart (d):
Demand and supply.
Subpart (d):
Answer to Problem 4P
Price will indeterminate and quantity shifts up – d.
Explanation of Solution
When both the demand and supply increases, it will lead to an increase in the equilibrium quantity and the change in price is indeterminate. This is because an increase in the supply puts a downward pressure on the equilibrium price. This is shown below in Figure – 4:
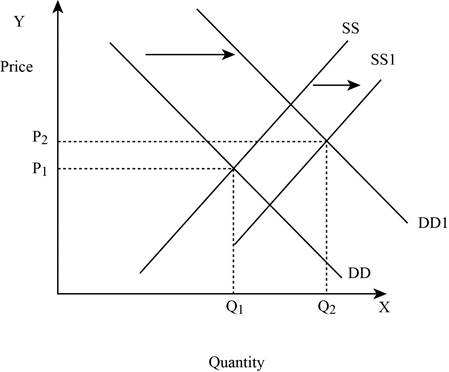
Figure -4
In Figure -4, the horizontal axis measures the quantity supplied and the vertical axis measures the price of the balls. ‘DD’ represents the demand curve and ‘SS’ represents the supply curve. Due to the increase in supply and demand, the supply curve shifts to the right from SS to SS1 and the demand curve shifts from DD to DD1. An increase in the supply leads to an increase in the equilibrium price from ‘P1 to P2’ and the equilibrium quantity from ‘Q1 to Q2’.
Concept introduction:
Demand: Demand refers to the total value of the goods and services that are demanded at a particular price in the given period of time.
Supply: Supply refers to the total value of the goods and services that are available for purchase at a particular price in the given period of time.
Subpart (e):
Demand and supply.
Subpart (e):
Answer to Problem 4P
Price shifts up and quantity shifts up – e.
Explanation of Solution
If the demand increases with constant supply, it leads to an increase in the equilibrium quantity and equilibrium price. This is shown below in Figure – 5:
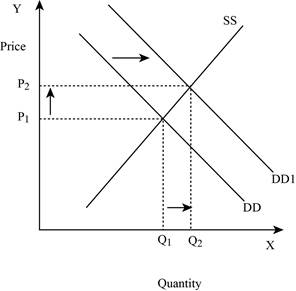
Figure -5
In Figure -5, the horizontal axis measures the quantity supplied and the vertical axis measures the price of the balls. ‘DD’ represents the demand curve and ‘SS’ represents the supply curve. Due to an increase in demand, the demand curve will shift the curve to the right from DD to DD1. An increase in demand will increase the equilibrium price from ‘P1 to P2’ and increases the equilibrium quantity from ‘Q1 to Q2’.
Concept introduction:
Demand: Demand refers to the total value of the goods and services that are demanded at a particular price in the given period of time.
Supply: Supply refers to the total value of the goods and services that are available for purchase at a particular price in the given period of time.
Subpart (f):
Demand and supply.
Subpart (f):
Answer to Problem 4P
Price shifts down and quantity indeterminate – f.
Explanation of Solution
If the supply increases with a decrease in demand, it leads to a decrease in the equilibrium price because both the curves put a pressure on the equilibrium price. Thus, an increase in supply increases the equilibrium quantity and a decrease in demand lead to a decrease in the equilibrium quantity. This is shown below in Figure – 6:
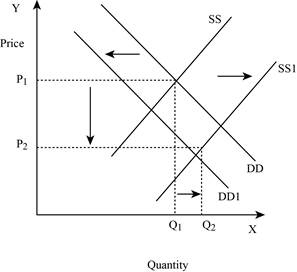
Figure -6
In Figure -6, the horizontal axis measures the quantity supplied and the vertical axis measures the price of the balls. ‘DD’ represents the demand curve and ‘SS’ represents the supply curve. Due to a decrease in demand and an increase in supply, demand curve will shift the curve to the left from DD to DD1. An increase in supply will lead to an increase in the equilibrium quantity from ‘P1 to P2’ and increases the equilibrium quantity from ‘Q1 to Q2’.
Concept introduction:
Demand: Demand refers to the total value of the goods and services that are demanded at a particular price in the given period of time.
Supply: Supply refers to the total value of the goods and services that are available for purchase at a particular price in the given period of time.
Subpart (g):
Demand and supply.
Subpart (g):
Answer to Problem 4P
Price shifts up and quantity indeterminate – g.
Explanation of Solution
If the supply decreases with an increase in demand, it will lead to an increase in the equilibrium price because both the curve put a pressure on the equilibrium price. An increase in demand will lead to an increase in the equilibrium quantity. This is shown below in Figure – 7:
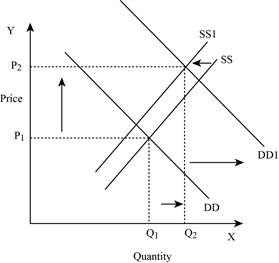
Figure -7
In Figure -7, the horizontal axis measures the quantity supplied and the vertical axis measures the price of the balls. ‘DD’ represents the demand and ‘SS’ represents the supply curve. Due to a decrease in supply and an increase in demand, the supply curve will shift the curve to the left from SS to SS1 and the demand curve shifts the curve to the right, which leads to an increase in the equilibrium price from ‘P1 to P2’ and the equilibrium quantity from ‘Q1 to Q2’.
Concept introduction:
Demand: Demand refers to the total value of the goods and services that are demanded at a particular price in the given period of time.
Supply: Supply refers to the total value of the goods and services that are available for purchase at a particular price in the given period of time.
Subpart (h):
Demand and supply.
Subpart (h):
Answer to Problem 4P
Price indeterminate and quantity shifts down – h.
Explanation of Solution
If both the supply and demand decreases, then it lead to a decrease in the equilibrium quantity and the change in equilibrium price is indeterminate. This is because a decrease in supply puts an upward pressure on the equilibrium price. This is shown below in Figure – 8:
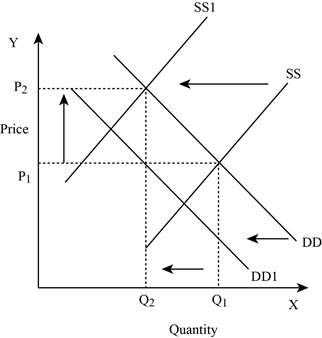
Figure -8
In Figure -8, the horizontal axis measures the quantity supplied and the vertical axis measures the price of the balls. ‘DD’ represents the demand and ‘SS’ represents the supply curve. Due to a decrease in supply and a decrease in demand, the supply curve will shift the curve to the left from SS to SS1 and the demand curve shifts the curve to the left, which lead to an increase in the equilibrium price from ‘P1 to P2’ and a decrease in the equilibrium quantity from ‘Q1 to Q2’.
Concept introduction:
Demand: Demand refers to the total value of the goods and services that are demanded at a particular price in the given period of time.
Supply: Supply refers to the total value of the goods and services that are available for purchase at a particular price in the given period of time.
Want to see more full solutions like this?
Chapter 3 Solutions
Economics (Irwin Economics)

- a. b. Test Your Understanding Price Supply 1 $4.00 60 4.25 70 4.50 80 4.75 90 (5.00 100 5.25 110 5.50 120 What are equilibrium price and quantity? Supply increases by 50% - what are the new equilibrium price and quantity? Demand 140 130 120 110 100 90 80 2014 McGraw-Hill Ryerson Limited Supply 2 LO6 2-45arrow_forwardIn November 2021, there is a simultaneous change in the market for Covid-19 vaccines in China. Total demand has increased by 50% and the supply increased by 70% in the domestic market due to technological advances in the production methods. What should you observe at the new market equilibrium point based on this situation? (Hint: both curves are normal in shapes) O a. Price decreases, equilibrium quantity exchanged decreases O b. Price decreases, equilibrium quantity exchanged increases O c. Price increases, equilibrium quantity exchanged increases d. Price increases, equilibrium quantity exchanged is undeterminedarrow_forwardQuantity Demanded 6 7 8 9 10 11 12 Price $8 7 6 5 4 3 2 Refer to the above table. If demand decreased by 4 units at each price and supply decreased by 2 units at each price, what would the new equilibrium price and quantity be? Multiple Choice O $6 and 6 units $5 and 5 units O $4 and 6 units Quantity Supplied 10 9 8 7 6 5 4 $7 and 7 unitsarrow_forward
- Figure 5 below represents two different shifts that occurs in the market for potato chips. All of the shifts go from the curves labeled with a "1" to curves labeled with a "2". Assume that potato chips are an inferior good. Refer to the figure as you answer the questions that follow. P Shift 1 S2 S1 D1 Figure 5 Shift 2 S1 D1 D2arrow_forwardWhich one of the following statements is correct? O A. A fall in the price of a good will result in a rightward shift of the demand curve, ceteris paribus (i.e. the demand for the product will increase). O B. A rise in the price of a good will cause the supply curve of that good to shift to the right (i.e. the supply of the good will increase). O C. A decrease in the prices of the factors of production used to produce a certain product will give rise to an increase in the supply of the product (illustrated by a rightward shift of the supply curve). O D. Demand is a synonym for wants. In other words, if a consumer demands a good it simply means that he or she wants the good.arrow_forward5. Show how a change in the price of one good affects the supply of another. Use the graph to show how an increase in the price of organic onions would shift the demand curve, supply curve, or both curves in the market for tomatoes. Assume that onions and tomatoes are neither complements nor substitutes. Market for Tomatoes 10 9. Supply 8 7 4 Demand 1 4 8 10 12 14 16 18 20 Quantity (Ibs) LO 3. 2. Price ($)arrow_forward
- 1. Let (inverse) demand be Pb = 115 - 5 Qb and (inverse) supply be Pv = 29 + 4 Qv. What price will prevail in the market if it is competitive? Answer: your answer Price ($) $140 $120 $100 $80 $ 60 $40 $20 $0 0 8 LO 5 Submit Demand 10 Supply Quantity 15 Eqm 20 25arrow_forwardRefer to the supply and demand curve diagram below, if supply decrease by 25 units at each price level, what is the new equilibirum price and quantity? 2$ 10 9. 8. 6. 4. 1. 10 20 30 40 50 60 70 O A. P-$6 Q = 5 O B. P=$7 Q = 25 O C. P=$8 Q = 15 O D. P=$6 Q = 30arrow_forwardSuppose that the incomes of buyers in a particular market for a normal good decrease and there is also a reduction in input prices. What would we expect to occur in this market? Select one: O a. Equilibrium quantity would decrease, but the impact on equilibrium price would be ambiguous. cross out O b. The equilibrium price would decrease, but the impact on the amount sold in the market would be ambiguous. cross out cross out O c. Equilibrium quantity would increase, but the impact on equilibrium price would be ambiguous. cross out O d. The equilibrium price would increase, but the impact on the amount sold in the market would be ambiguous.arrow_forward
- 100 200 300 400 500 600 Quantity (millions of bushels of wheat) In the figure, the equilibrium price is initially $3 per bushel of wheat. If suppliers come to expect that. the price of a bushel of wheat will rise in the future, but buyers do not, the current equilibrium price will Select one: O a. not change. O b. Perhaps rise, fall, or stay the same, depending on whether there are more demanders or suppliers in the market. O c. rise. O d. fall. 4. 2. Price (dollars per bushel of wheatarrow_forwardles of Macroeconomics - Spring21 Which of the following statements is CORRECT? Select one: O a. A change in the quantity demanded means a shift in the demand curve. O b. Achange in demand means a movement along the demand curve. O c. Achange in demand and change in quantity demanded means the same thing. O d. Achange in demand means a shift in the demand curve while change in the quantity demanded means a movement along the demand curve. NEXT PAGEarrow_forwardSuppose an economic boom causes incomes to increase and, at the same time, drives up wages for the sales representatives who work for cell phone companies. Assume that smartphones are a normal good. This will cause the: O price of cell phones and the equilibrium quantity to rise. O price of cell phones to rise, but the change in the equilibrium quantity is unclear and depends on whether the shift in demand is larger or smaller than the shift in supply. O price of cell phones and the equilibrium quantity to fall. O quantity of cell phones to rise, but the change in the equilibrium price is unclear and depends on whether the shift in demand is larger or smaller than the shift in supply.arrow_forward

 Principles of Economics (12th Edition)EconomicsISBN:9780134078779Author:Karl E. Case, Ray C. Fair, Sharon E. OsterPublisher:PEARSON
 Engineering Economy (17th Edition)EconomicsISBN:9780134870069Author:William G. Sullivan, Elin M. Wicks, C. Patrick KoellingPublisher:PEARSON
 Principles of Economics (MindTap Course List)EconomicsISBN:9781305585126Author:N. Gregory MankiwPublisher:Cengage Learning
 Managerial Economics: A Problem Solving ApproachEconomicsISBN:9781337106665Author:Luke M. Froeb, Brian T. McCann, Michael R. Ward, Mike ShorPublisher:Cengage Learning
 Managerial Economics & Business Strategy (Mcgraw-...EconomicsISBN:9781259290619Author:Michael Baye, Jeff PrincePublisher:McGraw-Hill Education