
Videos
(a)
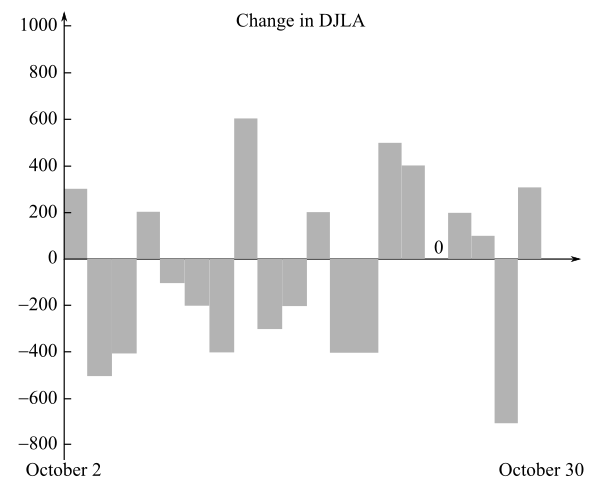
The values of X if X is the (rounded) change in the Dow on a randomly selected day where the chart shows the day-by-day change, rounded to the nearest
(b)
To calculate: The frequency and probability distributions of X if X is the (rounded) change in the Dow on a randomly selected day where the chart shows the day-by-day change, rounded to the nearest
(c)
To calculate: The probability that on a randomly selected day, the Dow decreased by more than

Trending nowThis is a popular solution!

Chapter 8 Solutions
Finite Mathematics


- The figure below shows timber production in particular months from 2000 to 2005. Which of the following months of the year seems to have the lowest timber production? (a) January (b) April (c) July (d) Octoberarrow_forwardQ. Table gives data on gold prices, the Consumer Price Index (CPI), and the New York Stock Exchange (NYSE) Index for the United States for the period 1974 –2006. The NYSE Index includes most of the stocks listed on the NYSE, some 1500-plus. a. Plot in the same scattergram gold prices, CPI, and the NYSE Index. b. An investment is supposed to be a hedge against inflation if its price and /or rate of return at least keeps pace with inflation. To test this hypothesis, suppose you decide to fit the following model, assuming the scatterplot in (a) suggests that this is appropriate: Gold pricet = β1 + β2 CPIt + ut NYSE indext = β1 + β2 CPIt + ut Note that if beta2 = 1 the response exactly grows with CPI Thank you!arrow_forwardBecause of high tuition costs at state and private universities, enrollments atcommunity colleges have increased dramatically in recent years. The following data show theenrollment (in thousands) for Jefferson Community College from 2001–2009:Year Period (t) Enrollment (1000s)2001 1 6.52002 2 8.12003 3 8.42004 4 10.22005 5 12.52006 6 13.32007 7 13.72008 8 17.22009 9 18.1Compute F10: the Forecast for 2010. Compute Pearson’s Correlation Coefficient Use the Method of Least Squares to obtain the Best-Fit-Line for this data. Use the line to compute the forecast.arrow_forward
- Using the countries assigned in Question 1, collect data on the quarterly (not seasonallyadjusted) consumer price index rate for 2001 – 2020.Provided in screenshots Year Quarter CPI rate Seasonal Index Period De-seasonalized CPI rate (i) Compute the CMAs for the four quarters of 2002 and 2003 manually (Show ALLworkings). (ii) Use EXCEL to complete the calculation of the CMAs and the seasonal indices for2001 - 2020. Provide a table with the de-seasonalized input variables. iii)Using R-Studio, estimate a regression equation to determine the effect of time(period) on the De-Seasonalized CPI rate. Write down the forecast equation. (Allcodes and regression output should be provided).first two pictures are screenshots but the last section is pasted here 2018-04-01 1.0330755668451100 2018-07-01 0.3272675677575110 2018-10-01 -0.0574947362577725 2019-01-01 0.3351160342574930 2019-04-01 1.1985132267461000 2019-07-01 0.2741660078433930…arrow_forwardThe table shows the historical in-state tuition rates for the University of Kalamazoo. Use the data to answer the questions and round your answers to two decimal places. Academic year Rate of tuition for one semester 2008–2009 $3,812 2009–2010 $4,002 2010–2011 $4,441 2011–2012 $4,905 2012–2013 $5,181 What is the percentage increase in tuition from the 2008–2009 school year to the 2012–2013 school year?arrow_forwardThe annual revenue of Amazon is given in the table below (sourceLinks to an external site.). Year Amazon Annual Revenue(Billions of US dollars) 2020 386.064 2019 280.522 2018 232.887 2017 177.866 2016 135.987 2015 107.006 2014 88.988 2013 74.452 2012 61.093 2011 48.077 2010 34.204 In what year will the estimated revenue of Amazon be 1,357 billion US dollars? Note: I am asking for the year, not the number of years since 2010. This may happen between two years. Round to the nearest year.arrow_forward
- Annualized percentage return on investment (as compared to the Standard & Poor's 500 Index) for 10 randomly selected stock screeners are reproduced in the table. Complete parts a through c.arrow_forwardTable 6 shows the year and the number ofpeople unemployed in a particular city for several years. Determine whether the trend appears linear. If so, and assuming the trend continues, in what year will the number of unemployed reach 5 people?arrow_forwardThe revenue for Google for the years 2010–2014 is shown in the following table (Wallstreet Journal, August 2014). Deflate the revenue in dollars based on the CPI (1982–1984base period). Comment on the company’s revenue in deflated dollars. Year Revenue ($ billions) CPI2010 29.3 218.12011 37.9 224.92012 50.2 229.62013 59.8 233.02014 66.7 236.7arrow_forward
- Complete Part D A recent issue of the AARP Bulletin reported that the average weekly pay for a woman with a high school degree is $520 (AARP Bulletin, January–February, 2010). Suppose you would like to determine if the average weekly pay for all working women is significantly greater than that for women with a high school degree. Data providing the weekly pay for a sample of 50 working women are available in the file named WeeklyPay. These data are consistent with the findings reported in the AARP article. Complete D null hyposthesis: H(o)=520Alternative hypothesis: H(a): greater then 520 sample mean=637.94 the test statistic = 5.62 p-value=0.00 Using a=.05, we would reject the null hypothesis. D. Repeat the hypothesis test using the critical value approach. 582 333 759 633 629 523 320 685 599 753 553 641 290 800 696 627 679 667 542 619 950 614 548 570 678 697 750 569…arrow_forwardExercise 5: Index Numbers Statistica displayed the following chart of the most dangerous jobs in America during 2020. The data is sourced from the U.S. Bureau of Labor Statistics and show the number of deaths on the job per 100,000 workers.arrow_forwardA stock has monthly returns of 9%, 22%, 15%, and 28%. What is the stock's geometric average return?arrow_forward
