
Finite Mathematics
7th Edition
ISBN: 9781337280426
Author: Stefan Waner, Steven Costenoble
Publisher: Cengage Learning
expand_more
expand_more
format_list_bulleted
Concept explainers
Videos
Question
Chapter 8.4, Problem 70E
To determine
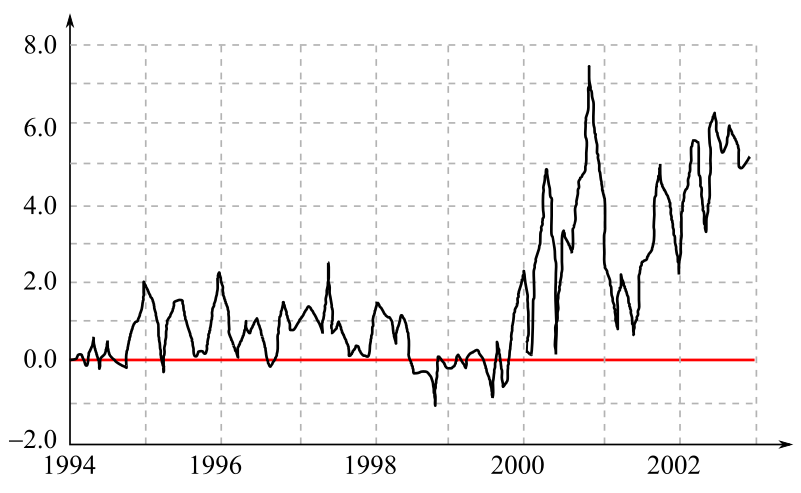
The correct statements out of the following statements:
(A): Both the mean and standard deviation show an upward trend from
(B): The mean but not the standard deviation, shows an upward trend from
(C): The demand for electric power peaked in the second half of
(D): The standard deviation was larger in the second half of
(E): The mean of the monthly means in
If the chart shows the approximate monthly means of the power grid frequency, in
Expert Solution & Answer
Want to see the full answer?
Check out a sample textbook solution
Students have asked these similar questions
In 2009, the population of the U.S., broken down by regions, was 54.6 million in the Northeast, 66.0 million in the Midwest, 111.8 million in the South, and 70.6 million in the West. The table below shows the population movement during the period 2008–2009. (Thus, 99.23% of the population in the Northeast stayed there, while 0.16% of the population in the Northeast moved to the Midwest, and so on.)†
To
Northeast
Midwest
South
West
From
Northeast
0.9923
0.0016
0.0042
0.0019
Midwest
0.0018
0.9896
0.0047
0.0039
South
0.0056
0.0059
0.9827
0.0058
West
0.0024
0.0033
0.0044
0.9899
Use matrix inversion and multiplication to estimate the population in each region in 2008. (Round all answers to the nearest 0.1 million.)
SEE PICTURE!!!
Large companies typically collect volumes of data before designing a product, not only to gain information as to whether the product should be released, but also to pinpoint which markets would be the best targets for the product. Several months ago, I was interviewed by such a company while shopping at a mall. I was asked about my exercise habits and whether or not I'd be interested in buying a video/DVD designed to teach stretching exercises. I fall into the male, 18 – 35-years-old category, and I guessed that, like me, many males in that category would not be interested in a stretching video. My friend Amanda falls in the female, older-than-35 category, and I was thinking that she might like the stretching video. After being interviewed, I looked at the interviewer's results. Of the 97 people in my market category who had been interviewed, 16 said they would buy the product, and of the 101 people in Amanda's market category, 31 said they would buy it. Assuming that these data came…
Large companies typically collect volumes of data before designing a product, not only to gain information as to whether the product should be released, but also to pinpoint which markets would be the best targets for the product. Several months ago, I was interviewed by such a company while shopping at a mall. I was asked about my exercise habits and whether or not I'd be interested in buying a video/DVD designed to teach stretching exercises. I fall into the male, 18 – 35-years-old category, and I guessed that, like me, many males in that category would not be interested in a stretching video. My friend Diane falls in the female, older-than-35 category, and I was thinking that she might like the stretching video. After being interviewed, I looked at the interviewer's results. Of the 93 people in my market category who had been interviewed, 17 said they would buy the product, and of the 113 people in Diane's market category, 34 said they would buy it. Assuming that these data came…
Chapter 8 Solutions
Finite Mathematics
Ch. 8.1 - In Exercises 110, classify the random variable X...Ch. 8.1 - Prob. 2ECh. 8.1 - Prob. 3ECh. 8.1 - In Exercises 110, classify the random variable X...Ch. 8.1 - In Exercises 110, classify the random variable X...Ch. 8.1 - Prob. 6ECh. 8.1 - In Exercises 110, classify the random variable X...Ch. 8.1 - Prob. 8ECh. 8.1 - Prob. 9ECh. 8.1 - In Exercises 110, classify the random variable X...
Ch. 8.1 - In Exercises 1118, (a) say what an appropriate...Ch. 8.1 - In Exercises 1118, (a) say what an appropriate...Ch. 8.1 - Prob. 13ECh. 8.1 - In Exercises 1118, (a) say what an appropriate...Ch. 8.1 - In Exercises 1118, (a) say what an appropriate...Ch. 8.1 - In Exercises 1118, (a) say what an appropriate...Ch. 8.1 - In Exercises 1118, (a) say what an appropriate...Ch. 8.1 - Prob. 18ECh. 8.1 - Prob. 19ECh. 8.1 - The random variable X has the probability...Ch. 8.1 - In Exercises 2128, give the probability...Ch. 8.1 - In Exercises 2128, give the probability...Ch. 8.1 - Prob. 23ECh. 8.1 - In Exercises 2128, give the probability...Ch. 8.1 - In Exercises 2128, give the probability...Ch. 8.1 - In Exercises 2128, give the probability...Ch. 8.1 - Prob. 27ECh. 8.1 - Prob. 28ECh. 8.1 - 2010 Income Distribution up to $100,000 The...Ch. 8.1 - 2003 Income Distribution up to $100,000 Repeat...Ch. 8.1 - Population Age in Mexico The following chart shows...Ch. 8.1 - Population Age in the United States Repeat...Ch. 8.1 - Sport Utility VehiclesTow Ratings The following...Ch. 8.1 - Housing Prices Going into the Real Estate Bubble...Ch. 8.1 - Stock Market Gyrations The following chart shows...Ch. 8.1 - Prob. 36ECh. 8.1 - Prob. 37ECh. 8.1 - Test Scores Your scores for the 20 surprise math...Ch. 8.1 - Car Purchases To persuade his parents to...Ch. 8.1 - Car Purchases Carmines parents, not convinced of...Ch. 8.1 - Prob. 41ECh. 8.1 - Prob. 42ECh. 8.1 - Prob. 43ECh. 8.1 - Prob. 44ECh. 8.1 - Highway Safety Exercises 4150 are based on the...Ch. 8.1 - Prob. 46ECh. 8.1 - Highway Safety Exercises 4150 are based on the...Ch. 8.1 - Prob. 48ECh. 8.1 - Prob. 49ECh. 8.1 - Highway Safety Exercises 4150 are based on the...Ch. 8.1 - Prob. 51ECh. 8.1 - Prob. 52ECh. 8.1 - Prob. 53ECh. 8.1 - Prob. 54ECh. 8.1 - Prob. 55ECh. 8.1 - Prob. 56ECh. 8.1 - Prob. 57ECh. 8.1 - Prob. 58ECh. 8.1 - Prob. 59ECh. 8.1 - Give an example of a real-life situation that can...Ch. 8.1 - Prob. 61ECh. 8.1 - Prob. 62ECh. 8.1 - Prob. 63ECh. 8.1 - Prob. 64ECh. 8.2 - In Exercises 110, you are performing five...Ch. 8.2 - Prob. 2ECh. 8.2 - Prob. 3ECh. 8.2 - In Exercises 110, you are performing five...Ch. 8.2 - In Exercises 110, you are performing five...Ch. 8.2 - Prob. 6ECh. 8.2 - In Exercises 110, you are performing five...Ch. 8.2 - In Exercises 110, you are performing five...Ch. 8.2 - Prob. 9ECh. 8.2 - In Exercises 110, you are performing five...Ch. 8.2 - In Exercises 1118, X is a binomial variable with...Ch. 8.2 - In Exercises 1118, X is a binomial variable with...Ch. 8.2 - In Exercises 1118, X is a binomial variable with...Ch. 8.2 - Prob. 14ECh. 8.2 - In Exercises 1118, X is a binomial variable with...Ch. 8.2 - In Exercises 1118, X is a binomial variable with...Ch. 8.2 - Prob. 17ECh. 8.2 - Prob. 18ECh. 8.2 - In Exercises 19 and 20, graph the histogram of the...Ch. 8.2 - In Exercises 19 and 20, graph the histogram of the...Ch. 8.2 - In Exercises 21 and 22, graph the histogram of the...Ch. 8.2 - Prob. 22ECh. 8.2 - Internet Addiction The probability that a randomly...Ch. 8.2 - Prob. 24ECh. 8.2 - 1990s Internet Stock Boom According to a July 1999...Ch. 8.2 - 1990s Internet Stock Boom According to the article...Ch. 8.2 - Prob. 27ECh. 8.2 - Prob. 28ECh. 8.2 - Manufacturing Your manufacturing plant produces...Ch. 8.2 - Manufacturing Compute the probability distribution...Ch. 8.2 - Prob. 31ECh. 8.2 - Other Teenage Pastimes According to the study...Ch. 8.2 - Prob. 33ECh. 8.2 - Prob. 34ECh. 8.2 - Triple Redundancy To ensure reliable performance...Ch. 8.2 - IQ Scores Mensa is a club for people who have high...Ch. 8.2 - Prob. 37ECh. 8.2 - Prob. 38ECh. 8.2 - Prob. 39ECh. 8.2 - Product Testing It is known that 65% of all the...Ch. 8.2 - Prob. 41ECh. 8.2 - Prob. 42ECh. 8.2 - Highway Safety According to a study,18 a male...Ch. 8.2 - Prob. 44ECh. 8.2 - Mad Cow Disease In March 2004 the U.S. Department...Ch. 8.2 - Prob. 46ECh. 8.2 - Prob. 47ECh. 8.2 - Prob. 48ECh. 8.2 - Prob. 49ECh. 8.2 - Prob. 50ECh. 8.2 - Prob. 51ECh. 8.2 - Prob. 52ECh. 8.2 - Prob. 53ECh. 8.2 - Prob. 54ECh. 8.3 - Compute the mean, median, and mode of the data...Ch. 8.3 - Prob. 2ECh. 8.3 - Prob. 3ECh. 8.3 - Compute the mean, median, and mode of the data...Ch. 8.3 - Compute the mean, median, and mode of the data...Ch. 8.3 - Prob. 6ECh. 8.3 - Prob. 7ECh. 8.3 - Compute the mean, median, and mode of the data...Ch. 8.3 - Prob. 9ECh. 8.3 - Give a sample of five scores with mean 100 and...Ch. 8.3 - In Exercises 1116, calculate the expected value of...Ch. 8.3 - In Exercises 1116, calculate the expected value of...Ch. 8.3 - Prob. 13ECh. 8.3 - Prob. 14ECh. 8.3 - In Exercises 1116, calculate the expected value of...Ch. 8.3 - In Exercises 1116, calculate the expected value of...Ch. 8.3 - In Exercises 1728, calculate the expected value of...Ch. 8.3 - Prob. 18ECh. 8.3 - Prob. 19ECh. 8.3 - In Exercises 1728, calculate the expected value of...Ch. 8.3 - Prob. 21ECh. 8.3 - Prob. 22ECh. 8.3 - Prob. 23ECh. 8.3 - In Exercises 1728, calculate the expected value of...Ch. 8.3 - In Exercises 1728, calculate the expected value of...Ch. 8.3 - In Exercises 1728, calculate the expected value of...Ch. 8.3 - Prob. 27ECh. 8.3 - Prob. 28ECh. 8.3 - Stock Market Gyrations Following is a sample of...Ch. 8.3 - Stock Market Gyrations Following is a sample of...Ch. 8.3 - Gold The following figures show the price of gold...Ch. 8.3 - Silver The following figures show the price of...Ch. 8.3 - Supermarkets A survey of 52 U.S. supermarkets...Ch. 8.3 - Video Arcades Your company, Sonic Video, Inc., has...Ch. 8.3 - School Enrollment The following table shows the...Ch. 8.3 - School Enrollment Repeat Exercise 35, using the...Ch. 8.3 - Prob. 37ECh. 8.3 - Prob. 38ECh. 8.3 - 2010 Income Distribution up to $100,000 The...Ch. 8.3 - 2003 Income Distribution up to $100,000 Repeat...Ch. 8.3 - Prob. 41ECh. 8.3 - Prob. 42ECh. 8.3 - Prob. 43ECh. 8.3 - Prob. 44ECh. 8.3 - Roulette A roulette wheel has the numbers 1...Ch. 8.3 - Roulette A roulette wheel has the numbers 1...Ch. 8.3 - Prob. 47ECh. 8.3 - Prob. 48ECh. 8.3 - Prob. 49ECh. 8.3 - Spiders Your pet tarantula, Spider, has a .12...Ch. 8.3 - Exercises 51 and 52 assume familiarity with...Ch. 8.3 - Exercises 51 and 52 assume familiarity with...Ch. 8.3 - Elimination Tournaments In an elimination...Ch. 8.3 - Elimination Tournaments In an elimination...Ch. 8.3 - Elimination Tournaments In an elimination...Ch. 8.3 - Elimination Tournaments In an elimination...Ch. 8.3 - Prob. 57ECh. 8.3 - Prob. 58ECh. 8.3 - Prob. 59ECh. 8.3 - Insurance The Blue Sky Flight Insurance Company...Ch. 8.3 - Prob. 61ECh. 8.3 - Prob. 62ECh. 8.3 - Prob. 63ECh. 8.3 - Prob. 64ECh. 8.3 - Prob. 65ECh. 8.3 - Prob. 66ECh. 8.3 - Prob. 67ECh. 8.3 - Prob. 68ECh. 8.3 - Slim tells you that the population mean is just...Ch. 8.3 - Prob. 70ECh. 8.3 - Prob. 71ECh. 8.3 - Prob. 72ECh. 8.3 - Prob. 73ECh. 8.3 - Prob. 74ECh. 8.4 - In Exercises 18, compute the (sample) variance and...Ch. 8.4 - Prob. 2ECh. 8.4 - Prob. 3ECh. 8.4 - In Exercises 18, compute the (sample) variance and...Ch. 8.4 - In Exercises 18, compute the (sample) variance and...Ch. 8.4 - Prob. 6ECh. 8.4 - Prob. 7ECh. 8.4 - In Exercises 18, compute the (sample) variance and...Ch. 8.4 - In Exercises 914, calculate the standard deviation...Ch. 8.4 - In Exercises 914, calculate the standard deviation...Ch. 8.4 - Prob. 11ECh. 8.4 - In Exercises 914, calculate the standard deviation...Ch. 8.4 - Prob. 13ECh. 8.4 - In Exercises 914, calculate the standard deviation...Ch. 8.4 - In Exercises 1524, calculate the expected value,...Ch. 8.4 - Prob. 16ECh. 8.4 - Prob. 17ECh. 8.4 - Prob. 18ECh. 8.4 - Prob. 19ECh. 8.4 - In Exercises 1524, calculate the expected value,...Ch. 8.4 - In Exercises 1524, calculate the expected value,...Ch. 8.4 - Prob. 22ECh. 8.4 - Prob. 23ECh. 8.4 - Prob. 24ECh. 8.4 - Popularity Ratings In your bid to be elected class...Ch. 8.4 - Popularity Ratings Your candidacy for elected...Ch. 8.4 - Unemployment Following is a sample of unemployment...Ch. 8.4 - Unemployment Following is a sample of unemployment...Ch. 8.4 - Stock Market Gyrations Following is a sample of...Ch. 8.4 - Stock Market Gyrations Following is a sample of...Ch. 8.4 - Sport Utility Vehicles Following are highway...Ch. 8.4 - Sport Utility Vehicles Following are the city...Ch. 8.4 - Shopping Malls A survey of all the shopping malls...Ch. 8.4 - Prob. 34ECh. 8.4 - 2010 Income Distribution up to $100,000 The...Ch. 8.4 - Prob. 36ECh. 8.4 - Hispanic Employment: Male The following table...Ch. 8.4 - Hispanic Employment: Female Repeat Exercise 37,...Ch. 8.4 - Commerce You have been told that the average life...Ch. 8.4 - Commerce You have been told that the average life...Ch. 8.4 - Batmobiles The average life span of a Batmobile is...Ch. 8.4 - Spiderman Coupes The average life span of a...Ch. 8.4 - Teenage Pastimes According to a study,51 the...Ch. 8.4 - Prob. 44ECh. 8.4 - Teenage Marketing In 2000, 22% of all teenagers in...Ch. 8.4 - Prob. 46ECh. 8.4 - Prob. 47ECh. 8.4 - Video Arcades Your company, Sonic Video, Inc., has...Ch. 8.4 - Prob. 49ECh. 8.4 - Distribution of Wealth If we model after-tax...Ch. 8.4 - Prob. 51ECh. 8.4 - Prob. 52ECh. 8.4 - Prob. 53ECh. 8.4 - Prob. 54ECh. 8.4 - Distribution of Wealth If we model after-tax...Ch. 8.4 - Prob. 56ECh. 8.4 - Prob. 57ECh. 8.4 - Prob. 58ECh. 8.4 - Prob. 59ECh. 8.4 - Distribution of Wealth If we model after-tax...Ch. 8.4 - Prob. 61ECh. 8.4 - Prob. 62ECh. 8.4 - Prob. 63ECh. 8.4 - Prob. 64ECh. 8.4 - Prob. 65ECh. 8.4 - Prob. 66ECh. 8.4 - Prob. 67ECh. 8.4 - Prob. 68ECh. 8.4 - Prob. 69ECh. 8.4 - Prob. 70ECh. 8.4 - Prob. 71ECh. 8.4 - Prob. 72ECh. 8.4 - Prob. 73ECh. 8.4 - Prob. 74ECh. 8.4 - Prob. 75ECh. 8.4 - Prob. 76ECh. 8.4 - Prob. 77ECh. 8.4 - Prob. 78ECh. 8.4 - Prob. 79ECh. 8.4 - Prob. 80ECh. 8.5 - In Exercises 18, Z is the standard normal...Ch. 8.5 - Prob. 2ECh. 8.5 - Prob. 3ECh. 8.5 - In Exercises 18, Z is the standard normal...Ch. 8.5 - In Exercises 18, Z is the standard normal...Ch. 8.5 - Prob. 6ECh. 8.5 - Prob. 7ECh. 8.5 - Prob. 8ECh. 8.5 - In Exercises 914, X has a normal distribution with...Ch. 8.5 - In Exercises 914, X has a normal distribution with...Ch. 8.5 - Prob. 11ECh. 8.5 - In Exercises 914, X has a normal distribution with...Ch. 8.5 - Prob. 13ECh. 8.5 - In Exercises 914, X has a normal distribution with...Ch. 8.5 - Find the probability that a normal variable takes...Ch. 8.5 - Find the probability that a normal variable takes...Ch. 8.5 - Prob. 17ECh. 8.5 - Prob. 18ECh. 8.5 - Prob. 19ECh. 8.5 - Suppose X is a normal random variable with mean...Ch. 8.5 - Suppose X is a normal random variable with mean...Ch. 8.5 - Prob. 22ECh. 8.5 - If you roll a die 100 times, what is the...Ch. 8.5 - If you roll a die 100 times, what is the...Ch. 8.5 - If you roll a die 200 times, what is the...Ch. 8.5 - Prob. 26ECh. 8.5 - SAT Scores SAT test scores are normally...Ch. 8.5 - Prob. 28ECh. 8.5 - LSAT Scores LSAT test scores are normally...Ch. 8.5 - LSAT Scores LSAT test scores are normally...Ch. 8.5 - Prob. 31ECh. 8.5 - Prob. 32ECh. 8.5 - Prob. 33ECh. 8.5 - Prob. 34ECh. 8.5 - SAT Scores SAT test scores are normally...Ch. 8.5 - LSAT Scores LSAT test scores are normally...Ch. 8.5 - Baseball The mean batting average in major league...Ch. 8.5 - Baseball The mean batting average in major league...Ch. 8.5 - Prob. 39ECh. 8.5 - Marketing Your hot sauce company rates its sauce...Ch. 8.5 - Prob. 41ECh. 8.5 - Prob. 42ECh. 8.5 - Prob. 43ECh. 8.5 - Prob. 44ECh. 8.5 - Distribution of Income If we model after-tax...Ch. 8.5 - Prob. 46ECh. 8.5 - Prob. 47ECh. 8.5 - Prob. 48ECh. 8.5 - Prob. 49ECh. 8.5 - Prob. 50ECh. 8.5 - Prob. 51ECh. 8.5 - Prob. 52ECh. 8.5 - Prob. 53ECh. 8.5 - Prob. 54ECh. 8.5 - Prob. 55ECh. 8.5 - Prob. 56ECh. 8.5 - Prob. 57ECh. 8.5 - Prob. 58ECh. 8.5 - Aviation The probability of a plane crashing on a...Ch. 8.5 - Prob. 60ECh. 8.5 - Prob. 61ECh. 8.5 - Prob. 62ECh. 8.5 - Prob. 63ECh. 8.5 - Prob. 64ECh. 8.5 - Prob. 65ECh. 8.5 - Prob. 66ECh. 8.5 - Prob. 67ECh. 8.5 - Prob. 68ECh. 8.5 - Prob. 69ECh. 8.5 - Prob. 70ECh. 8.5 - Prob. 71ECh. 8.5 - Prob. 72ECh. 8.5 - Prob. 73ECh. 8.5 - Prob. 74ECh. 8 - In Exercises 16, find the probability distribution...Ch. 8 - Prob. 2RECh. 8 - Prob. 3RECh. 8 - Prob. 4RECh. 8 - In Exercises 16, find the probability distribution...Ch. 8 - Prob. 6RECh. 8 - Prob. 7RECh. 8 - Prob. 8RECh. 8 - Prob. 9RECh. 8 - Prob. 10RECh. 8 - Prob. 11RECh. 8 - Prob. 12RECh. 8 - Prob. 13RECh. 8 - Prob. 14RECh. 8 - Prob. 15RECh. 8 - A die is constructed in such a way that rolling a...Ch. 8 - Prob. 17RECh. 8 - Prob. 18RECh. 8 - Prob. 19RECh. 8 - Prob. 20RECh. 8 - Prob. 21RECh. 8 - Prob. 22RECh. 8 - Prob. 23RECh. 8 - Prob. 24RECh. 8 - Prob. 25RECh. 8 - Prob. 26RECh. 8 - Prob. 27RECh. 8 - Prob. 28RECh. 8 - Prob. 29RECh. 8 - Prob. 30RECh. 8 - Prob. 31RECh. 8 - In Exercises 2934 the mean and standard deviation...Ch. 8 - Prob. 33RECh. 8 - Prob. 34RECh. 8 - Prob. 35RECh. 8 - Prob. 36RECh. 8 - Prob. 37RECh. 8 - Prob. 38RECh. 8 - Prob. 39RECh. 8 - Prob. 40RECh. 8 - Prob. 41RECh. 8 - Prob. 42RECh. 8 - Prob. 43RECh. 8 - Mac vs. Windows On average, 5% of all hits by Mac...Ch. 8 - Prob. 45RECh. 8 - Prob. 46RECh. 8 - Prob. 47RECh. 8 - Prob. 48RECh. 8 - Prob. 49RECh. 8 - Prob. 50RECh. 8 - Prob. 51RECh. 8 - Prob. 52RECh. 8 - Prob. 53RECh. 8 - Prob. 54RECh. 8 - Prob. 55RECh. 8 - Prob. 56RECh. 8 - Prob. 1CSCh. 8 - Prob. 2CSCh. 8 - Prob. 3CSCh. 8 - Prob. 4CSCh. 8 - Which of the following lists of data would you...Ch. 8 - Prob. 6CSCh. 8 - Prob. 7CSCh. 8 - Prob. 8CS
Knowledge Booster


Learn more about
Need a deep-dive on the concept behind this application? Look no further. Learn more about this topic, subject and related others by exploring similar questions and additional content below.Similar questions
- (a) For United States, provide data for the variables below over the years 1993 –2007:(i) Net migration rate (per 1,000 population)(ii) Total fertility rate (live births per woman)(iii)Unemployment, general level (Thousands)(iv) Wages(v) Life expectancy at birth for both sexes combined (years)Data can be obtained from the UN database http://data.un.org/Explorer.aspxUsing R-Studio, estimate a regression equation to determine the effect of unemployment,general level, wages and life expectancy at birth for both sexes on the net migration rate.(All codes and regression output should be provided).(i) Write down the regression equation. (ii) Interpret the coefficients and determine which of the individual coefficients in theregression model are statistically significant. In responding, construct and test anyappropriate hypothesis. (iii) Interpret the coefficient of determination.arrow_forwardZane is examining two studies involving how different generations classify specified items as either luxuries or necessities. In the first study, generation A is defined to be people ages 18–29. The second study defined generation A to be people ages 22–33. Zane notices that the first study was conducted in 2002 while the second one was conducted in 2006 (a) According to the 2002 study, what are the birth years of generation A? The Sand Canyon Archaeological Project, edited by W. D. Lipe and published by Crow Canyon Archaeological Center, contains the stem-and-leaf diagram shown below. The study uses tree rings to accurately determine the year in which a tree was cut. The figure gives the tree-ring-cutting dates for samples of timbers found in the architectural units at Sand Canyon Pueblo. The text referring to the figure says, "The three-digit numbers in the left column represent centuries and decades A.D. The numbers to the right represent individual years, with each number derived…arrow_forwardEXERCISE 18.2 2. y= 3x +6 1. yax-1 4. y+2x 3 3. y=-+ 2 Gradient ords ent - the change en two ates change in the gradient between (2; 4) and (4; 6) is B2 Answers A(2: 4) 4- 1. The co The g Gradient change in yatue change in wakue 2. The The 3. THarrow_forward
- An observational study is conducted to compare experiences of men and women between the ages of 50‒59 years, following coronary artery bypass surgery. Participants undergo the surgery and are followed until the time of death, until they are lost to follow-up, or up to 30 years, whichever comes first. The following table details the experiences of participating men and women. The data below are years of death or years of last contact for men and women. Men Women Year of Death Year of Last Contact Year of Death Year of Last Contact 5 8 19 4 12 17 20 9 14 24 21 14 23 26 24 15 29 26 17 27 19 29 21 30 22 30 24 30 25 30 a) Estimate the survival functions for each treatment group using the Kaplan-Meier approach. b) Test whether there is a significant difference in survival between treatment groups using the log rank test and a 5 percent…arrow_forward. e-Filing Tax Returns The Internal Revenue ServiceRestructuring and Reform Act (RRA) was signed intolaw by President Bill Clinton in 1998. A major objective ofthe RRA was to promote electronic filing of tax returns.The data in the table that follows show the percentage ofindividual income tax returns filed electronically for filingyears 2004–2012. Since the percentage P of returns filedelectronically depends on the filing year y, and each inputcorresponds to exactly one output, the percentage ofreturns filed electronically is a function of the filing year; soP1y2 represents the percentage of returns filed electronicallyfor filing year y.(a) Find the average rate of change of the percentage ofe-filed returns from 2004 to 2006.(b) Find the average rate of change of the percentage ofe-filed returns from 2007 to 2009.(c) Find the average rate of change of the percentage ofe-filed returns from 2010 to 2012.(d) What is happening to the average rate of change as timepasses?arrow_forwardThe United States Department of Agriculture (USDA), in conjunction with the Forest Service, publishes information to assist companies in estimating the cost of building a temporary road for such activities as a timber sale. Such roads are generally built for one or two seasons of use for limited traffic and are designed with the goal of reestablishing vegetative cover on the roadway and adjacent disturbed area within ten years after the termination of the contract, permit, or lease. The timber sale contract requires out sloping, removal of culverts and ditches, and building water bars or cross ditches after the road is no longer needed. As part of this estimation process, the company needs to estimate haul costs. The USDA publishes variable costs in dollars per cubic- yard-mile of hauling dirt according to the speed with which the vehicle can drive. Speeds are mainly determined by the road width, the sight distance, the grade, the curves, and the turnouts. Thus, on a steep, narrow,…arrow_forward
- 1) Carbon Dioxide EmissionsCarbon emissions contribute to climate change, which has serious consequences for humans and theirenvironment. According to the U.S. Environmental Protection Agency, carbon emissions, in the form ofcarbon dioxide (CO2), make up more than 80 percent of the greenhouse gases emitted in the UnitedStates (EPA, 2019). The burning of fossil fuels releases CO2 and other greenhouse gases. These carbonemissions raise global temperatures by trapping solar energy in the atmosphere. This alters watersupplies and weather patterns, changes the growing season for food crops, and threatens coastalcommunities with increasing sea levels (EPA, 2016).The amount of CO2 emitted per year A (in tons) for a vehicle that averages x miles per gallon of gas, canbe approximated by the function A(x) = 0.0089x 2 − 0.815x + 22.3. a) Determine the average rate of change of the amount of CO2 emitted in a year over the interval[20, 25], and interpret its meaning.b) Determine the average rate of…arrow_forwarda) For United States, provide data for the variables below over the years 1993 – 2007: (i) Net migration rate (per 1,000 population) (ii) Total fertility rate (live births per woman) (iii)Unemployment, general level (Thousands) (iv) Wages (v) Life expectancy at birth for both sexes combined (years) Data can be obtained from the UN database http://data.un.org/Explorer.aspx Using R-Studio, estimate a regression equation to determine the effect of unemployment, general level, wages and life expectancy at birth for both sexes on the net migration rate. (All codes and regression output should be provided).(i) Write down the regression equation. (ii) Interpret the coefficients and determine which of the individual coefficients in theregression model are statistically significant. In responding, construct and test anyappropriate hypothesis. (iii) Interpret the coefficient of determination. (iv) Using the 10% level of significance, determine and discuss whether the overallregression equation…arrow_forwardA researcher wondered if attainment within six years among students who receive grants as sart of their educational funding (Group 1) was lower than attainment within six years among students who did not receive grants as part of their educational funding (Group 2). Atainment is defined as whether the student earned the degree or certificate that heishe set out to eam upon enrolment. Complete parts (a) through (c) below. A. 2 1 Cannot be determined (c) In part (b), we learned that two groups (students who receive grants and students who do not receive grants) are being compared. In addition, the sampling method is independent. State the null and altemative hypotheses for this test Hg.arrow_forward
- Exercise 6.3.2 and Exercise 6.3.3arrow_forwardI. Write P if it is a primary source and S if it is a secondary source. There is a price adjustment on our electric bill according to the latest news. * Students of BS-Biology gathered important features of their research from the data published in the newspapers. * A weatherman reports the development of a typhoon signal in the affected area. A student of BS Psychology is directly observing the behavior of patients with depression. *arrow_forwardBuilding Year of sale 1 2005 1 2005 2 2007 2007 2004 2007 2007 2008 2008 2008 ID Property # Area (ft.) Price 1030 11 Apartment 30 743.09 $ 246,172.68 1029 10 Apartment 29 756.21 $ 246,331.90 2002 7 Apartment 2 587.28 $ 209,280.91 2031 12 Apartment 31 1604.75 $ 452,667.01 1049 11 Apartment 49 1375.45 $ 467,083.31 3011 9 Apartment 11 675.19 $ 203,491.85 3026 9 Apartment 670.89 $ 212,520.83 3023 1 Apartment 720.81 $ 198,591.85 1031 6 Apartment $ 265,467.68 782.25 794.52 4023 3 Apartment $ 235,633.26 Customer Entity Name Surname Interval Gender Country State ID C0028 Individual Madalyn Mercer 19 18-25 F USA California Home C0027 Individual Lara Carrillo 22 18-25 F USA California Home C0112 Individual Donavan Flowers 22 18-25 M USA California Home C0160 Individual Darien Dorsey 22 18-25 M USA California Investment C0014 Individual Alessandra Perry 25 18-25 F USA California Home C0125 Individual Kaitlin Owen 26 26-35 F USA Virginia Investment C0125 Individual Kaitlin Owen 26 26-35 F USA…arrow_forward
arrow_back_ios
SEE MORE QUESTIONS
arrow_forward_ios
Recommended textbooks for you
 Discrete Mathematics and Its Applications ( 8th I...MathISBN:9781259676512Author:Kenneth H RosenPublisher:McGraw-Hill Education
 Mathematics for Elementary Teachers with Activiti...MathISBN:9780134392790Author:Beckmann, SybillaPublisher:PEARSON
 Thinking Mathematically (7th Edition)MathISBN:9780134683713Author:Robert F. BlitzerPublisher:PEARSON
 Discrete Mathematics With ApplicationsMathISBN:9781337694193Author:EPP, Susanna S.Publisher:Cengage Learning,
 Pathways To Math Literacy (looseleaf)MathISBN:9781259985607Author:David Sobecki Professor, Brian A. MercerPublisher:McGraw-Hill Education
Discrete Mathematics and Its Applications ( 8th I...
Math
ISBN:9781259676512
Author:Kenneth H Rosen
Publisher:McGraw-Hill Education
Mathematics for Elementary Teachers with Activiti...
Math
ISBN:9780134392790
Author:Beckmann, Sybilla
Publisher:PEARSON
Thinking Mathematically (7th Edition)
Math
ISBN:9780134683713
Author:Robert F. Blitzer
Publisher:PEARSON
Discrete Mathematics With Applications
Math
ISBN:9781337694193
Author:EPP, Susanna S.
Publisher:Cengage Learning,
Pathways To Math Literacy (looseleaf)
Math
ISBN:9781259985607
Author:David Sobecki Professor, Brian A. Mercer
Publisher:McGraw-Hill Education
Which is the best chart: Selecting among 14 types of charts Part II; Author: 365 Data Science;https://www.youtube.com/watch?v=qGaIB-bRn-A;License: Standard YouTube License, CC-BY