
Concept explainers
Videos
Shared leadership in airplane crews. Human Factors (March 2014) published a study that examined the effect of shared leadership by the cockpit and cabin crews of a commercial airplane. Simulated flights were taken by 84 six-person crews, where each crew consisted of a two-person cockpit (captain and first officer) and a four-person cabin team (three flight attendants and a purser.) During the simulation, smoke appeared in the cabin and the reactions of the crew were monitored for teamwork. Each crew was rated as working either successfully or unsuccessfully as a team. Also, each individual member was evaluated for leadership (measured as number of leadership
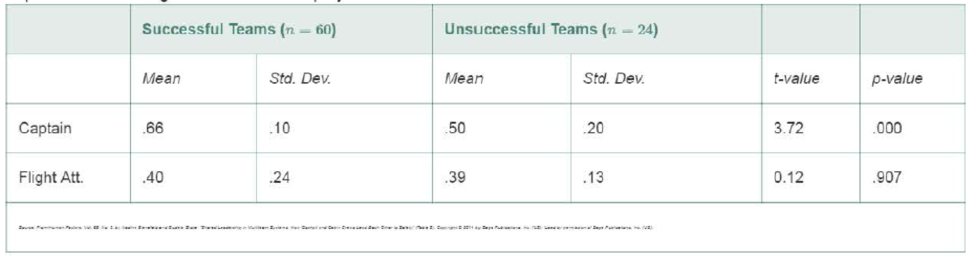
- a. Consider the data for captains. Interpret the p-value for testing (at α = .05) whether the mean leadership values for captains from successful and unsuccessful teams differ.
- b. Consider the data for flight attendants. Interpret the p-value for testing (at α = .05) whether the mean leadership values for flight attendants from successful and unsuccessful teams differ.
Want to see the full answer?
Check out a sample textbook solution
Chapter 8 Solutions
Statistics for Business and Economics (13th Edition)


- The Bureau of Transportation Statistics reports on-time performance for airlines at major U.S. airports. JetBlue, United, and US Airways share Terminal C at Boston’s Logan Airport. The percentage of on-time flights reported for a sample month were 76.8% for JetBlue, 71.5% for United, and 82.2% for US Airways. Assume that 30% of the flights arriving at Terminal C are JetBlue flights, 32% are United flights, and 38% US Airways flights. Develop a joint probability table with three rows (the airlines) and two columns (on- time and late). An announcement is made that Flight 1382 will be arriving at gate 20 of Terminal C. What is the probability that Flight 1382 will arrive on time? What is the most likely airline for Flight 1382? What is the probability that Flight 1382 is by this airline? Suppose that an announcement is made saying that Flight 1382 will now be arriving late. What is the most likely airline for this flight? What is the probability that Flight 1382 is by this…arrow_forwardStudy 2: Pill Appearance and Perceived Pain. Does the shape or color of a pain pill influence its effectiveness? Although logically it shouldn’t, whether we believe a drug will work does have a powerful effect on our perceptions (e.g., placebo effect). In this experiment, 4 groups of adult patients were given the same amount of Advil after dental surgery for pain relief, but the color and shape of the pill varied. Researchers hypothesized that an unusual shape or color would lead people to believe the pills were new and special and thus would expect them to be more effective than common round, white pills. Researchers also wanted to know if there is an interaction between shape and color Data Labels ShapePill {1=Round; 2=Diamond} ColorPill {1=White; 2=BlueGreen} Gender {0=Woman; 1=Man; 2=Nonbinary person) Descriptions of the Variables and Descriptive Statistics: Referring to the JASP output, and using sentences, present the descriptive statistics of each group: for example:…arrow_forwardDoes the example represent an observational study or an experiment? Car accident data is obtained from the Ohio database. It is found that more accidents happened at night.arrow_forward
- can you help me with my homework Need help with the problem belowarrow_forwardA seven-year medical research study reported that women whose mothers took the drugDES during pregnancy were twice as likely to develop tissue abnormalities that might leadto cancer as were women whose mothers did not take the drug.a. This study compared two populations. What were the populations?arrow_forwardExergamers are active videogames such as rhythmic dancing games, virtual bicycles, balance board simulators, and virtual simulators that require a screen and console. A study of exergaming practiced by students from grades 10 and 11 in Montreal, Canada, examined many factors related to participation in exergaming. Of 358 students who reported that they stressed about their health, 29.9% said that they were exergamers. Of the 851 students who reported that they did not stress about their health, 20.8% said they were exergamers. Use a signifigance test to compare the proportions. Write a short statement interpreting this result.arrow_forward
- Researchers investigated factors that influenced how much people like each other based on first meeting. They were particularly interested in the effects of eye-to-eye contact and smiling. They collected data from 20 participants. Each participant was asked to wait in a small room while the experimenter went next door, ostensibly to gather the materials needed for the study. While the participant was waiting, a confederate of the experimenter entered the room and sat in a chair facing the participant, and asked "Are you waiting for the experiment?". Immediately after asking the question, the confederate smiled at, and/or looked directly into the eyes of, the participant. This was done in four conditions: for five participants the confederate smiled and looked into the participant's eye, for five participants the confederate smiled but did not look into the participant's eye, for five participants the confederate did not smile but did look into the participant's eyes, and for five…arrow_forwardCoffee and Depression. Researchers conducted a study investigating the relationship between caffeinated coffee consumption and risk of depression in women. They collected data on 50,739 women free of depression symptoms at the start of the study in the year 1996, and these women were followed through 2006. The researchers used questionnaires to collect data on caffeinated coffee consumption, asked each individual about physician- diagnosed depression, and also asked about the use of antidepressants. The table below shows the distribution of incidences of depression by amount of caffeinated coffee consumption. Coffee ≤ 1 2-6 1 2-3 ≥ 4 Consumption cup/week cups/week cup/day cups/day cups/day Total Clinical Yes 670 373 905 564 95 2,607 depression No 11,545 6,244 16,329 11,726 2,288 48,132 Total 12,215 6,617 17,234…arrow_forwardBeer and blood alcohol content. Many people believe that gender, weight, drinking habits, and many other factors are much more important in predicting blood alcohol content (BAC) than simply considering the number of drinks a person consumed. Here we examine data from sixteen student volunteers at Ohio State University who each drank a randomly assigned number of cans of beer. These students were evenly divided between men and women, and they differed in weight and drinking habits. Thirty minutes later, a police officer measured their blood alcohol content (BAC) in grams of alcohol per deciliter of blood. The scatterplot and regression table summarize the findings. (a) Describe the relationship between the number of cans of beer and BAC.(b) Write the equation of the regression line. Interpret the slope and intercept in context.(c) Do the data provide strong evidence that drinking more cans of beer is associated with an increase inblood alcohol? State the null and alternative…arrow_forward
- Recent research indicates that the effectiveness of antidepressant medication is directly related to the severity of the depression (Khan, Brodhead, Kolts & Brown, 2005). Based on pretreatment depression scores, patients were divided into four groups based on their level of depression. After receiving the antidepressant medication, depression scores were measured again and the amount of improvement was recorded for each patient. The following data are similar to the results of the study. Low Moderate High Moderate Moderately Severe Severe 1.6 2.9 3.8 3.4 0.9 1.3 3 2.8 1.8 3.1 3.3 3.2 2.7 3.7 2.4 4.9 3.8 2.9 3.7 3.2 4.9 1.7 From this table, conduct an one-way ANOVA. Calculate the F-ratio and p-value. Be sure to round your answers to three decimal places. Assume all population and ANOVA requirements are met. F-ratio: p-value: What is your final conclusion? Use a significance level of a = 0.01. O There is sufficient evidence that there exists a significant difference between treatments. O…arrow_forwardRecent research indicates that the effectiveness of antidepressant medication is directly related to the severity of the depression (Khan, Brodhead, Kolts & Brown, 2005). Based on pretreatment depression scores, patients were divided into four groups based on their level of depression. After receiving the antidepressant medication, depression scores were measured again and the amount of improvement was recorded for each patient. The following data are similar to the results of the study. Low High Moderate Moderately Moderate Severe Severe 3.1 1.3 5.1 3.5 2.3 3.3 3.6 2.9 2.7 2.9 1.8 4.2 3 4 4.2 2 3.9 3.9 4.7 2.1 0.5 2.5 2.2 From this table, conduct an one-way ANOVA. Calculate the F-ratio and p-value. Be sure to round your answers to three decimal places. Assume all population and ANOVA requirements are met. F-ratio: p-value: What is your final conclusion? Use a significance level of a = 0.02. O There is not enough evidence to determine a difference between the treatments. O There is…arrow_forwardRecent research indicates that the effectiveness of antidepressant medication is directly related to the severity of the depression (Khan, Brodhead, Kolts & Brown, 2005). Based on pretreatment depression scores, patients were divided into four groups based on their level of depression. After receiving the antidepressant medication, depression scores were measured again and the amount of improvement was recorded for each patient. The following data are similar to the results of the study. Moderately High Moderate Low Moderate Severe Severe 1.3 1.4 3 2.5 1.3 2 3.8 4 2.5 0.4 5 2.5 2.2 1.5 3.8 3.2 1.7 2 1.7 2 3.1 2.1 4.1 1.6 From this table, conduct an one-way ANOVA. Calculate the F-ratio and p-value. Be sure to round your answers to three decimal places. Assume all population and ANOVA requirements are met. F-ratio: p-value:arrow_forward
 Glencoe Algebra 1, Student Edition, 9780079039897...AlgebraISBN:9780079039897Author:CarterPublisher:McGraw Hill
 Big Ideas Math A Bridge To Success Algebra 1: Stu...AlgebraISBN:9781680331141Author:HOUGHTON MIFFLIN HARCOURTPublisher:Houghton Mifflin Harcourt
 Holt Mcdougal Larson Pre-algebra: Student Edition...AlgebraISBN:9780547587776Author:HOLT MCDOUGALPublisher:HOLT MCDOUGAL