
Videos
(a)
To construct: the histogram
(a)
Explanation of Solution
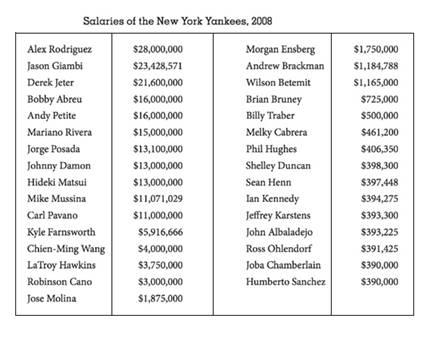
Given:
Graph:
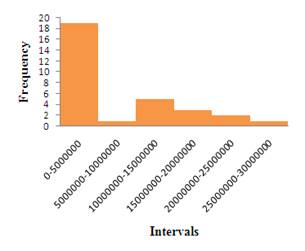
| Intervals | Frequency |
| 0-5000000 | 19 |
| 5000000-10000000 | 1 |
| 10000000-15000000 | 5 |
| 15000000-20000000 | 3 |
| 20000000-25000000 | 2 |
| 25000000-30000000 | 1 |
The distribution is skewed to right and it is clearing showing that
(b)
To Explain: the shape of the histogram
(b)
Explanation of Solution
By seeing the graph highest bar is in the left side of the histogram and lowest bar in the right side so the distribution would be skewed to right or positive skewed and mode would be between 0 and 5000000 because there is highest frequency which is 19 and all other bars are very lowest below frequency 4.
(c)
To Explain: the spread of the histogram.
(c)
Explanation of Solution
There is minimum value is $390000 and maximum value is $28000000 so the spread of the distribution would be between $390000 and $28000000.
Chapter 2 Solutions
Statistics Through Applications
Additional Math Textbook Solutions
Fundamentals of Statistics (5th Edition)
Statistical Reasoning for Everyday Life (5th Edition)
Statistics for Psychology
Intro Stats
Essentials of Statistics (6th Edition)


 MATLAB: An Introduction with ApplicationsStatisticsISBN:9781119256830Author:Amos GilatPublisher:John Wiley & Sons Inc
 Probability and Statistics for Engineering and th...StatisticsISBN:9781305251809Author:Jay L. DevorePublisher:Cengage Learning
 Statistics for The Behavioral Sciences (MindTap C...StatisticsISBN:9781305504912Author:Frederick J Gravetter, Larry B. WallnauPublisher:Cengage Learning
 Elementary Statistics: Picturing the World (7th E...StatisticsISBN:9780134683416Author:Ron Larson, Betsy FarberPublisher:PEARSON
 The Basic Practice of StatisticsStatisticsISBN:9781319042578Author:David S. Moore, William I. Notz, Michael A. FlignerPublisher:W. H. Freeman
 Introduction to the Practice of StatisticsStatisticsISBN:9781319013387Author:David S. Moore, George P. McCabe, Bruce A. CraigPublisher:W. H. Freeman