
Concept explainers
Videos
To Explain: the wrong thing with this picture.
Explanation of Solution
Given:
Line graph of lottery ticket sales in the United States, in millions of dollars from 1980 to 2007
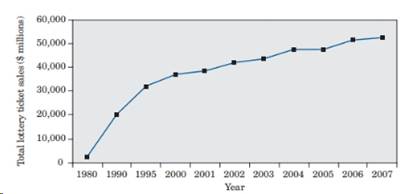
Graph is describing the lottery ticket sales in the year of 1980 to 2007 in which the x-axis is showing the years. The years are in not in consecutive manner. First interval is of 10 years, second and second interval is of 5 years, and after this all the year’s difference is 1 year which is wrong thing in this picture.
Chapter 2 Solutions
Statistics Through Applications
Additional Math Textbook Solutions
Statistical Reasoning for Everyday Life (5th Edition)
Introductory Statistics (10th Edition)
Introductory Statistics
Introductory Statistics (2nd Edition)
An Introduction to Mathematical Statistics and Its Applications (6th Edition)
Intro Stats, Books a la Carte Edition (5th Edition)


 MATLAB: An Introduction with ApplicationsStatisticsISBN:9781119256830Author:Amos GilatPublisher:John Wiley & Sons Inc
 Probability and Statistics for Engineering and th...StatisticsISBN:9781305251809Author:Jay L. DevorePublisher:Cengage Learning
 Statistics for The Behavioral Sciences (MindTap C...StatisticsISBN:9781305504912Author:Frederick J Gravetter, Larry B. WallnauPublisher:Cengage Learning
 Elementary Statistics: Picturing the World (7th E...StatisticsISBN:9780134683416Author:Ron Larson, Betsy FarberPublisher:PEARSON
 The Basic Practice of StatisticsStatisticsISBN:9781319042578Author:David S. Moore, William I. Notz, Michael A. FlignerPublisher:W. H. Freeman
 Introduction to the Practice of StatisticsStatisticsISBN:9781319013387Author:David S. Moore, George P. McCabe, Bruce A. CraigPublisher:W. H. Freeman