
Modern Business Statistics with Microsoft Office Excel (with XLSTAT Education Edition Printed Access Card) (MindTap Course List)
6th Edition
ISBN: 9781337115186
Author: David R. Anderson, Dennis J. Sweeney, Thomas A. Williams, Jeffrey D. Camm, James J. Cochran
Publisher: Cengage Learning
expand_more
expand_more
format_list_bulleted
Videos
Textbook Question
Chapter 17.4, Problem 23E
The president of a small manufacturing firm is concerned about the continual increase in manufacturing costs over the past several years. The following figures provide a time series of the cost per unit for the firm’s leading product over the past eight years.
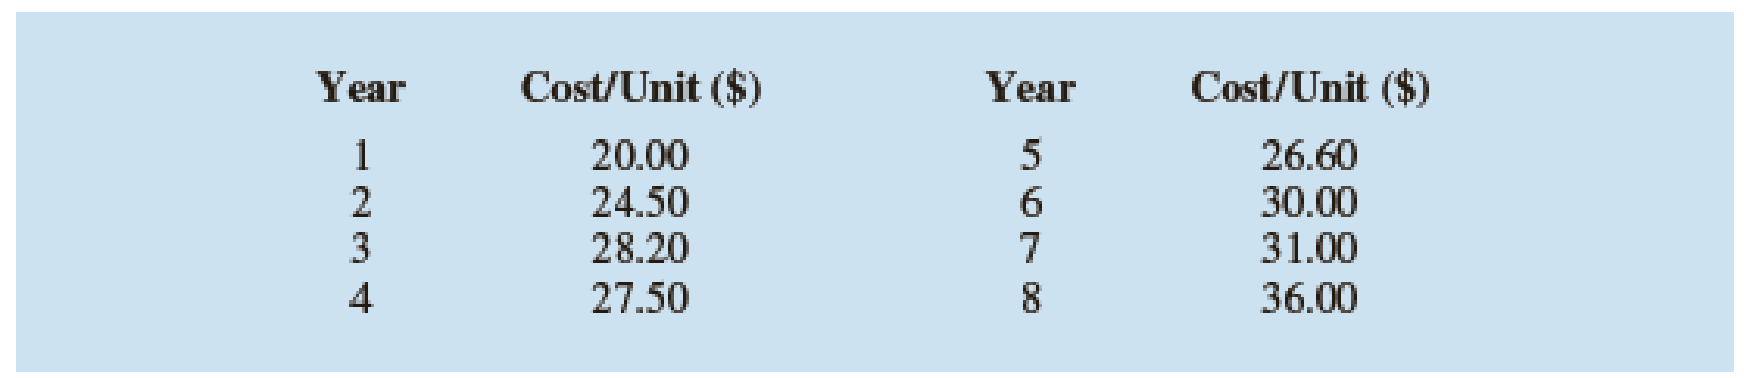
- a. Construct a time series plot. What type of pattern exists in the data?
- b. Develop the linear trend equation for this time series.
- c. What is the average cost increase that the firm has been realizing per year?
- d. Compute an estimate of the cost/unit for next year.
Expert Solution & Answer
Want to see the full answer?
Check out a sample textbook solution
Students have asked these similar questions
United Dairies, Inc., supplies milk to several independent grocers throughout DadeC ounty, Florida. Managers at United Dairies want to develop a forecast of the number ofhalf gallons of milk sold per week. Sales data for the past 12 weeks are:
a. Construct a time series plot. What type of pattern exists in the data?b. Use exponential smoothing with a 5 0.4 to develop a forecast of demand for week 13.What is the resulting MSE?
The diagram below illustrates the number of moose (red curve) and wolves (blue curve) between 1960 and 2015 in the Isle Royale National Park (USA). It does not show the actual data, but it approximates the trend. The vertical scale is from 0 to 50 for wolves and 0 to 2500 for moose.
In certain years the moose population was decreasing and the wolf population was increasing. Which of the options below represents such a year?
A. 1980
B. 1970
C. 2000
D. 2010
The accompanying data represent health care expenditures per capita (per person) as a percentage of the U.S. gross domestic product (GDP) from 2007 to 2013. Gross domestic product is the total value of all goods and services created during the course
of the year Complete parts (a) through (c) below.
Click the icon to view the data table.
(a) Construct a time-series plot that a politician would create to support the position that health care expenditures are increasing and must be slowed. Choose the correct graph below
OD.
O C.
OB
OA
A
Q
A
Q
Q
25,000+
11,000
Q
Q
3
2
G
HIER
11200
2H
7,000++
C
2013
of
+
2013
2007
2007
Year
Year
Year
(b) Construct a time-series plot that the health care industry would create to refute the opinion of the politician. Choose the correct graph below.
OB.
O C.
O A.
A
Q
A
Q
11,000
Q
(C)
7,000+
201
20
7.000+++++++*
2007
2007
2013
2013
Year
Year
(c) Explain how different measures may be used to support two completely different positions. Choose the correct answer…
Chapter 17 Solutions
Modern Business Statistics with Microsoft Office Excel (with XLSTAT Education Edition Printed Access Card) (MindTap Course List)
Ch. 17.2 - 1. Consider the following time series...Ch. 17.2 - 2. Refer to the time series data in exercise 1....Ch. 17.2 - Prob. 3ECh. 17.2 - 4. Consider the following time series...Ch. 17.3 - Consider the following time series...Ch. 17.3 - Consider the following time series...Ch. 17.3 - Refer to the gasoline sales time series data in...Ch. 17.3 - Prob. 8ECh. 17.3 - 9. With the gasoline time series data from Table...Ch. 17.3 - 10. With a smoothing constant of α = .2, equation...
Ch. 17.3 - For the Hawkins Company, the monthly percentages...Ch. 17.3 - Corporate triple-A bond interest rates for 12...Ch. 17.3 - The values of Alabama building contracts (in $...Ch. 17.3 - The following time series shows the sales of a...Ch. 17.3 - Ten weeks of data on the Commodity Futures Index...Ch. 17.3 - Prob. 16ECh. 17.4 - Consider the following time series...Ch. 17.4 - Prob. 18ECh. 17.4 - Prob. 19ECh. 17.4 - Prob. 20ECh. 17.4 - Prob. 21ECh. 17.4 - Prob. 22ECh. 17.4 - The president of a small manufacturing firm is...Ch. 17.4 - The following data shows the average interest rate...Ch. 17.4 - Quarterly revenue ($ millions) for Twitter for the...Ch. 17.4 - Giovanni Food Products produces and sells frozen...Ch. 17.4 - The number of users of Facebook from 2004 through...Ch. 17.5 - Consider the following time series.
Construct a...Ch. 17.5 - Consider the following time series...Ch. 17.5 - The quarterly sales data (number of copies sold)...Ch. 17.5 - Air pollution control specialists in southern...Ch. 17.5 - South Shore Construction builds permanent docks...Ch. 17.5 - Prob. 33ECh. 17.5 - Prob. 34ECh. 17.6 - Consider the following time series...Ch. 17.6 - Refer to exercise 35.
Deseasonalize the time...Ch. 17.6 - The quarterly sales data (number of copies sold)...Ch. 17.6 - Three years of monthly lawn-maintenance expenses...Ch. 17.6 - Air pollution control specialists in southern...Ch. 17.6 - Electric power consumption is measured in...Ch. 17 - The weekly demand (in cases) for a particular...Ch. 17 - The following table reports the percentage of...Ch. 17 - United Dairies, Inc., supplies milk to several...Ch. 17 - Annual retail store revenue for Apple from 2007 to...Ch. 17 - The Mayfair Department Store in Davenport, Iowa,...Ch. 17 - Prob. 47SECh. 17 - The Costello Music Company has been in business...Ch. 17 - Consider the Costello Music Company problem in...Ch. 17 - Prob. 50SECh. 17 - Refer to the Costello Music Company time series in...Ch. 17 - Prob. 52SECh. 17 - Refer to the Hudson Marine problem in exercise 52....Ch. 17 - Refer to the Hudson Marine problem in exercise...Ch. 17 - Refer to the Hudson Marine data in exercise...Ch. 17 - Forecasting Food and Beverage Sales
The Vintage...Ch. 17 - The Carlson Department Store suffered heavy damage...
Knowledge Booster


Learn more about
Need a deep-dive on the concept behind this application? Look no further. Learn more about this topic, statistics and related others by exploring similar questions and additional content below.Similar questions
- Table 6 shows the year and the number ofpeople unemployed in a particular city for several years. Determine whether the trend appears linear. If so, and assuming the trend continues, in what year will the number of unemployed reach 5 people?arrow_forwardTable 3 gives the annual sales (in millions of dollars) of a product from 1998 to 20006. What was the average rate of change of annual sales (a) between 2001 and 2002, and (b) between 2001 and 2004?arrow_forwardWhat does the y -intercept on the graph of a logistic equation correspond to for a population modeled by that equation?arrow_forward
- The U.S. Census tracks the percentage of persons 25 years or older who are college graduates. That data forseveral years is given in Table 4[14]. Determine whether the trend appears linear. If so, and assuming the trendcontinues. in what year will the percentage exceed 35%?arrow_forwardThe percentage of automobile consumers who are under 50 years of age decreased approximately linearly from 55.955.9% in 19701970 to 52.652.6% in 19801980. a. Predict when the percentage will be 4848%. b. Predict the percentage in 19851985. a. The percentage will be 4848% around the yeararrow_forwardhudson Marine has been an authorized dealer for c&d marine radios for the past sevenyears. the following table reports the number of radios sold each year.Year 1 2 3 4 5 6 7Number Sold 35 50 75 90 105 110 130a. construct a time series plot. does a linear trend appear to be present?b. Using Minitab or excel, develop a linear trend equation for this time series.c. Use the linear trend equation developed in part (b) to develop a forecast for annualsales in year 8.arrow_forward
- mex PLC has gathered following information on the sales of face mask from April 2020 to september 2020. Month Sales ($) April 17,000 May 18,000 June 19,500 July 22,000 August 21,000 September 23,000 You are required to3; a. Using linear trend equation forecast the sales of face masks for October 2020.arrow_forwardTable #2.3.7 contains the value of the house and the amount of rental income in a year that the house brings in ("Capital and rental," 2013). Create a scatter plot and state if there is a relationship between the value of the house and the annual rental income. Table #2.3.7: Data of House Value versus Rental Value Rental Value Rental Value Rental Value Rental 81000 6656 77000 4576 75000 7280 67500 6864 95000 7904 94000 8736 90000 6240 85000 7072 121000 12064 115000 7904 110000 7072 104000 7904 135000 8320 130000 9776 126000 6240 125000 7904 145000 8320 140000 9568 140000 9152 135000 7488 165000 13312 165000 8528 155000 7488 148000 8320 178000 11856 174000 10400 170000 9568 170000 12688 200000 12272 200000 10608 194000 11232 190000 8320 214000 8528 208000 10400 200000 10400 200000 8320 240000 10192…arrow_forward
arrow_back_ios
arrow_forward_ios
Recommended textbooks for you

 Calculus For The Life SciencesCalculusISBN:9780321964038Author:GREENWELL, Raymond N., RITCHEY, Nathan P., Lial, Margaret L.Publisher:Pearson Addison Wesley,
 College AlgebraAlgebraISBN:9781305115545Author:James Stewart, Lothar Redlin, Saleem WatsonPublisher:Cengage Learning
 Trigonometry (MindTap Course List)TrigonometryISBN:9781337278461Author:Ron LarsonPublisher:Cengage Learning
 Glencoe Algebra 1, Student Edition, 9780079039897...AlgebraISBN:9780079039897Author:CarterPublisher:McGraw Hill
Calculus For The Life Sciences
Calculus
ISBN:9780321964038
Author:GREENWELL, Raymond N., RITCHEY, Nathan P., Lial, Margaret L.
Publisher:Pearson Addison Wesley,
College Algebra
Algebra
ISBN:9781305115545
Author:James Stewart, Lothar Redlin, Saleem Watson
Publisher:Cengage Learning
Trigonometry (MindTap Course List)
Trigonometry
ISBN:9781337278461
Author:Ron Larson
Publisher:Cengage Learning
Glencoe Algebra 1, Student Edition, 9780079039897...
Algebra
ISBN:9780079039897
Author:Carter
Publisher:McGraw Hill
Time Series Analysis Theory & Uni-variate Forecasting Techniques; Author: Analytics University;https://www.youtube.com/watch?v=_X5q9FYLGxM;License: Standard YouTube License, CC-BY
Operations management 101: Time-series, forecasting introduction; Author: Brandoz Foltz;https://www.youtube.com/watch?v=EaqZP36ool8;License: Standard YouTube License, CC-BY