
Modern Business Statistics with Microsoft Office Excel (with XLSTAT Education Edition Printed Access Card) (MindTap Course List)
6th Edition
ISBN: 9781337115186
Author: David R. Anderson, Dennis J. Sweeney, Thomas A. Williams, Jeffrey D. Camm, James J. Cochran
Publisher: Cengage Learning
expand_more
expand_more
format_list_bulleted
Videos
Textbook Question
Chapter 17.5, Problem 32E
South Shore Construction builds permanent docks and seawalls along the southern shore of Long Island, New York. Although the firm has been in business only five years, revenue has increased from $308,000 in the first year of operation to $1,084,000 in the most recent year. The following data show the quarterly sales revenue in thousands of dollars.
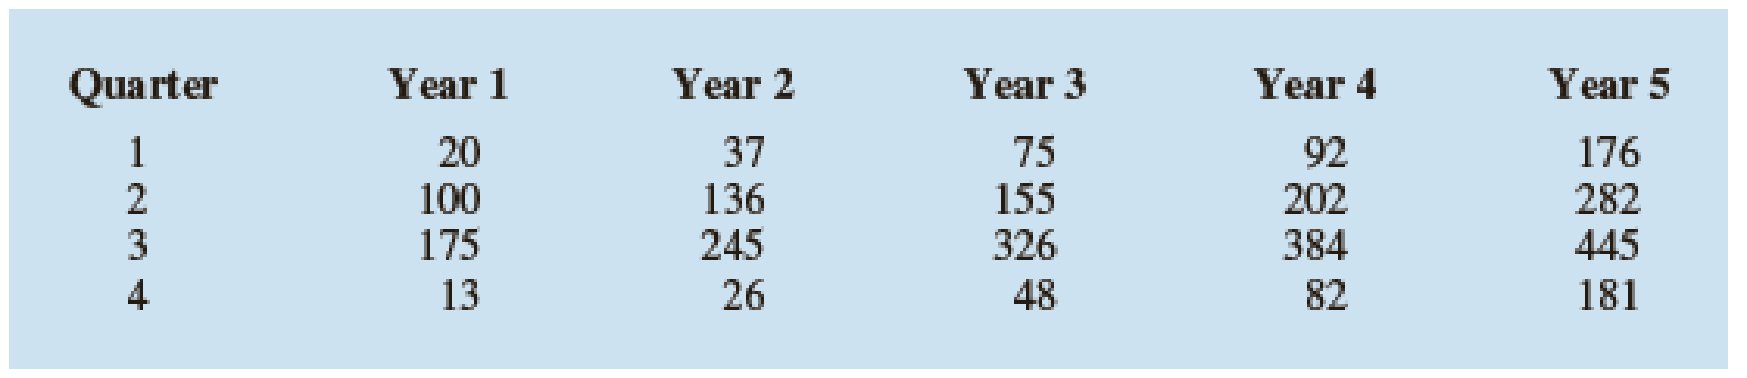
- a. Construct a time series plot. What type of pattern exists in the data?
- b. Use the following dummy variables to develop an estimated regression equation to account for seasonal effects in the data. Qtr1 = 1 if Quarter 1, 0 otherwise; Qtr2 = 1 if Quarter 2, 0 otherwise; Qtr3 = 1 if Quarter 3, 0 otherwise. Based only on the seasonal effects in the data, compute estimates of quarterly sales for year 6.
- c. Let Period = 1 to refer to the observation in quarter 1 of year 1; Period = 2 to refer to the observation in quarter 2 of year 1; … and Period = 20 to refer to the observation in quarter 4 of year 5. Using the dummy variables defined in part (b) and Period, develop an estimated regression equation to account for seasonal effects and any linear trend in the time series. Based upon the seasonal effects in the data and linear trend, compute estimates of quarterly sales for year 6.
Expert Solution & Answer

Trending nowThis is a popular solution!

Students have asked these similar questions
In retail, a store manager uses time series models to understand shopping trends.
Review the scatter plot of the store’s sales from 2010 through 2021 to answer the questions. See attached as image.
Here is the data for Fiscal Year and Sales:
Fiscal Year
Sales
2010
$260,123.00
2011
$256,853.00
2012
$274,366.00
2013
$290,525.00
2014
$322,318.00
2015
$380,921.00
2016
$541,925.00
2017
$909,050.00
2018
$1,817,521.00
2019
$3,206,564.00
2020
$4,921,005.00
2021
$5,686,338.00
Time series decomposition seeks to separate the time series (Y) into 4 components: trend (T), cycle (C), seasonal (S), and irregular (I). What is the difference between these components?
The model can be additive or multiplicative. When do you use each?
Review the scatter plot of the exponential trend of the time series data. Do you observe a trend? If so, what type of trend do you observe?
What predictions might you make about the store’s annual sales over the next few years?
Import Illinois.xls as a table. Using logical indexing to select the years with more than 2800 cases of
Diabetes. Then plot all of the data on the same axis.
F1
fx
Homicide
B
C
E
Year
Accidents
Cancer
Diabetes Heart Disease Homicide|
Suicide
1999
4125
25024
3004
33387
1023
1020
3
2000
4041
25365
2995
31844
991
1003
4.
2001
4077
24778
3092
30990
1087
1139
2002
4222
24737
3011
30821
1016
1145
2003
3942
24464
3044
29816
966
1011
7.
2004
4133
24289
3069
28284
871
1028
8.
2005
4182
24250
3034
28226
866
1086
9.
2006
4451
24084
2795
27007
865
1010
10
2007
4367
24115
2851
25813
863
1108
11
2008
4218
24300
2846
26078
872
1198
12
2009
3961
24185
2741
24931
881
1177
13
2010
3997
24070
2507
24959
783
1178
14
2011
4166
24007
2693
24987
812
1226
15
2012
4488
24562
2706
24667
832
1292
16
2013
4511
24491
2798
17
24839
792
1321
2014
4644
24501
2712
18
25024
792
1398
2015
4850
24713
2817
25652
19
863
1363
20
21
the costello Music company has been in business for five years. during that time, salesof pianos increased from 12 units in the first year to 76 units in the most recent year. Fredcostello, the firm’s owner, wants to develop a forecast of piano sales for the coming year.the historical data follow.Year 1 2 3 4 5Sales 12 28 34 50 76a. construct a time series plot. What type of pattern exists in the data?b. develop the linear trend equation for the time series. What is the average increase insales that the firm has been realizing per year?c. Forecast sales for years 6 and 7.
Chapter 17 Solutions
Modern Business Statistics with Microsoft Office Excel (with XLSTAT Education Edition Printed Access Card) (MindTap Course List)
Ch. 17.2 - 1. Consider the following time series...Ch. 17.2 - 2. Refer to the time series data in exercise 1....Ch. 17.2 - Prob. 3ECh. 17.2 - 4. Consider the following time series...Ch. 17.3 - Consider the following time series...Ch. 17.3 - Consider the following time series...Ch. 17.3 - Refer to the gasoline sales time series data in...Ch. 17.3 - Prob. 8ECh. 17.3 - 9. With the gasoline time series data from Table...Ch. 17.3 - 10. With a smoothing constant of α = .2, equation...
Ch. 17.3 - For the Hawkins Company, the monthly percentages...Ch. 17.3 - Corporate triple-A bond interest rates for 12...Ch. 17.3 - The values of Alabama building contracts (in $...Ch. 17.3 - The following time series shows the sales of a...Ch. 17.3 - Ten weeks of data on the Commodity Futures Index...Ch. 17.3 - Prob. 16ECh. 17.4 - Consider the following time series...Ch. 17.4 - Prob. 18ECh. 17.4 - Prob. 19ECh. 17.4 - Prob. 20ECh. 17.4 - Prob. 21ECh. 17.4 - Prob. 22ECh. 17.4 - The president of a small manufacturing firm is...Ch. 17.4 - The following data shows the average interest rate...Ch. 17.4 - Quarterly revenue ($ millions) for Twitter for the...Ch. 17.4 - Giovanni Food Products produces and sells frozen...Ch. 17.4 - The number of users of Facebook from 2004 through...Ch. 17.5 - Consider the following time series.
Construct a...Ch. 17.5 - Consider the following time series...Ch. 17.5 - The quarterly sales data (number of copies sold)...Ch. 17.5 - Air pollution control specialists in southern...Ch. 17.5 - South Shore Construction builds permanent docks...Ch. 17.5 - Prob. 33ECh. 17.5 - Prob. 34ECh. 17.6 - Consider the following time series...Ch. 17.6 - Refer to exercise 35.
Deseasonalize the time...Ch. 17.6 - The quarterly sales data (number of copies sold)...Ch. 17.6 - Three years of monthly lawn-maintenance expenses...Ch. 17.6 - Air pollution control specialists in southern...Ch. 17.6 - Electric power consumption is measured in...Ch. 17 - The weekly demand (in cases) for a particular...Ch. 17 - The following table reports the percentage of...Ch. 17 - United Dairies, Inc., supplies milk to several...Ch. 17 - Annual retail store revenue for Apple from 2007 to...Ch. 17 - The Mayfair Department Store in Davenport, Iowa,...Ch. 17 - Prob. 47SECh. 17 - The Costello Music Company has been in business...Ch. 17 - Consider the Costello Music Company problem in...Ch. 17 - Prob. 50SECh. 17 - Refer to the Costello Music Company time series in...Ch. 17 - Prob. 52SECh. 17 - Refer to the Hudson Marine problem in exercise 52....Ch. 17 - Refer to the Hudson Marine problem in exercise...Ch. 17 - Refer to the Hudson Marine data in exercise...Ch. 17 - Forecasting Food and Beverage Sales
The Vintage...Ch. 17 - The Carlson Department Store suffered heavy damage...
Knowledge Booster


Learn more about
Need a deep-dive on the concept behind this application? Look no further. Learn more about this topic, statistics and related others by exploring similar questions and additional content below.Similar questions
- Table 6 shows the year and the number ofpeople unemployed in a particular city for several years. Determine whether the trend appears linear. If so, and assuming the trend continues, in what year will the number of unemployed reach 5 people?arrow_forwardUsing the following time series data of U.S. new car sales ($ millions), respond to the following items. (The data is sourced from https://www.census.gov/retail/index.html#mrts. Find “Monthly Retail Trade Report,” then select “Time Series/Trend Charts” to find the data for U.S. new car sales.). Year $ Sales (Millions) 2009 486,565 2010 549,473 2011 608,788 2012 672,550 2013 735,374 2014 785,142 2015 842,122 2016 877,743 2017 911,157 2018 943,538 b. Test for autocorrelation using the 0.05 significance level. (Negative amounts should be indicated by a minus sign. Round your answers to 2 decimal places.) Year $ Sales (Millions) Predicted Residuals Lagged Residuals Squared Difference Squared Residuals 2009 486,565 2010 549,473 2011 608,788 2012 672,550 2013 735,374 2014 785,142 2015 842,122 2016 877,743 2017 911,157 2018 943,538…arrow_forwardThe Seneca Children’s Fund (SCC) is a local charity that runs a summer camp for disadvantagedchildren. The fund’s board of directors has been working very hard over recentyears to decrease the amount of overhead expenses, a major factor in how charities arerated by independent agencies. The following data show the percentage of the money SCChas raised that was spent on administrative and fund-raising expenses over the last sevenyears. a. Construct a time series plot. What type of pattern exists in the data?b. Use simple linear regression analysis to find the parameters for the line that minimizesMSE for this time series.c. Forecast the percentage of administrative expenses for year 8.d. If SCC can maintain its current trend in reducing administrative expenses, how longwill it take SCC to achieve a level of 5 percent or less?arrow_forward
Recommended textbooks for you
 Calculus For The Life SciencesCalculusISBN:9780321964038Author:GREENWELL, Raymond N., RITCHEY, Nathan P., Lial, Margaret L.Publisher:Pearson Addison Wesley,
 Glencoe Algebra 1, Student Edition, 9780079039897...AlgebraISBN:9780079039897Author:CarterPublisher:McGraw Hill
 Big Ideas Math A Bridge To Success Algebra 1: Stu...AlgebraISBN:9781680331141Author:HOUGHTON MIFFLIN HARCOURTPublisher:Houghton Mifflin Harcourt
 Trigonometry (MindTap Course List)TrigonometryISBN:9781305652224Author:Charles P. McKeague, Mark D. TurnerPublisher:Cengage Learning
 Holt Mcdougal Larson Pre-algebra: Student Edition...AlgebraISBN:9780547587776Author:HOLT MCDOUGALPublisher:HOLT MCDOUGAL
Calculus For The Life Sciences
Calculus
ISBN:9780321964038
Author:GREENWELL, Raymond N., RITCHEY, Nathan P., Lial, Margaret L.
Publisher:Pearson Addison Wesley,
Glencoe Algebra 1, Student Edition, 9780079039897...
Algebra
ISBN:9780079039897
Author:Carter
Publisher:McGraw Hill
Big Ideas Math A Bridge To Success Algebra 1: Stu...
Algebra
ISBN:9781680331141
Author:HOUGHTON MIFFLIN HARCOURT
Publisher:Houghton Mifflin Harcourt
Trigonometry (MindTap Course List)
Trigonometry
ISBN:9781305652224
Author:Charles P. McKeague, Mark D. Turner
Publisher:Cengage Learning
Holt Mcdougal Larson Pre-algebra: Student Edition...
Algebra
ISBN:9780547587776
Author:HOLT MCDOUGAL
Publisher:HOLT MCDOUGAL
Time Series Analysis Theory & Uni-variate Forecasting Techniques; Author: Analytics University;https://www.youtube.com/watch?v=_X5q9FYLGxM;License: Standard YouTube License, CC-BY
Operations management 101: Time-series, forecasting introduction; Author: Brandoz Foltz;https://www.youtube.com/watch?v=EaqZP36ool8;License: Standard YouTube License, CC-BY