
Videos
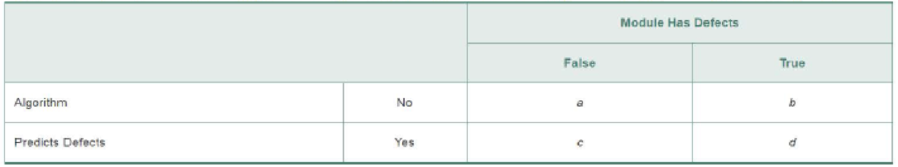
Software defects in NASA spacecraft instrument code. Portions of computer software code that may contain undetected defects are called blind spots. The issue of blind spots in software code evaluation was addressed at the 8th IEEE International Symposium on High Assurance Software Engineering (March 2004 ). The researchers developed guidelines for assessing methods of predicting software defects using data on 498 modules of software code written in “C” language for a NASA spacecraft instrument. One simple prediction algorithm is to count the lines of code in the module; any module with more than 50 lines of code is predicted to have a defect. The accompanying file contains the predicted and actual defect status of all 498 modules. A standard approach to evaluating a software defect prediction algorithm is to form a two-way summary table similar to the one shown here. In the table, a, b, c, and d represent the number of modules in each cell. Software engineers use these table entries to compute several
- a. Accuracy is defined as the probability that the prediction algorithm is correct. Write a formula for accuracy as a
function of the table values a, b, c, and d. - b. The detection rate is defined as the probability that the algorithm predicts a defect, given that the module actually is a defect. Write a formula for detection rate as a function of the table values a, b, c, and d.
- c. The false alarm rate is defined as the probability that the algorithm predicts a defect, given that the module actually has no defect. Write a formula for false alarm rate as a function of the table values a, b, c, and d.
- d. Precision is defined as the probability that the module has a defect, given that the algorithm predicts a defect. Write a formula for precision as a function of the table values a, b, c, and d.
- e. Access the accompanying file and compute the values of accuracy, detection rate, false alarm rate, and precision. Interpret the results.
Want to see the full answer?
Check out a sample textbook solution
Chapter 3 Solutions
Statistics for Business and Economics (13th Edition)
Additional Math Textbook Solutions
Statistics: Informed Decisions Using Data (5th Edition)
Elementary Statistics (Text Only)
Fundamentals of Statistics (5th Edition)
STATS:DATA+MODELS-W/DVD
Business Statistics: A First Course (8th Edition)
Elementary Statistics: A Step By Step Approach


- A researcher is interested in examining whether the location that a person lives is related to the number of hours that they spend on the internet each week. The researcher collected data from a sample of 30 participants who were classified in one of three groups: (1) 10 people who live in an urban setting, (2) 10 people who live in a suburban setting, and (3) 10 people who live in a rural setting. Each participant reported the number of hours they spend on the internet in a typical week (the dependent variable). The researcher found the following descriptive statistics: Urban participants reported an average of 8.9 hours of internet use per week with a standard deviation of 2.77. Suburban participants reported an average of 12.7 hours of internet use per week with a standard deviation of 4.88. Rural participants reported an average of 9.8 hours of internet use per week with a standard deviation of 2.82. Using the data that was collected, the researcher found the following: The…arrow_forwardA researcher is interested in examining whether the location that a person lives is related to the number of hours that they spend on the internet each week. The researcher collected data from a sample of 30 participants who were classified in one of three groups: (1) 10 people who live in an urban setting, (2) 10 people who live in a suburban setting, and (3) 10 people who live in a rural setting. Each participant reported the number of hours they spend on the internet in a typical week (the dependent variable). The researcher found the following descriptive statistics: Urban participants reported an average of 8.9 hours of internet use per week with a standard deviation of 2.77. Suburban participants reported an average of 12.7 hours of internet use per week with a standard deviation of 4.88. Rural participants reported an average of 9.8 hours of internet use per week with a standard deviation of 2.82. Using the data that was collected, the researcher found the following: The…arrow_forwardA researcher is interested in examining whether the location that a person lives is related to the number of hours that they spend on the internet each week. The researcher collected data from a sample of 30 participants who were classified in one of three groups: (1) 10 people who live in an urban setting, (2) 10 people who live in a suburban setting, and (3) 10 people who live in a rural setting. Each participant reported the number of hours they spend on the internet in a typical week (the dependent variable). The researcher found the following descriptive statistics: Urban participants reported an average of 8.9 hours of internet use per week with a standard deviation of 2.77. Suburban participants reported an average of 12.7 hours of internet use per week with a standard deviation of 4.88. Rural participants reported an average of 9.8 hours of internet use per week with a standard deviation of 2.82. Using the data that was collected, the researcher found the following: The…arrow_forward
- A wood products firm uses leftover time at the end of each week to make goods for stock. Currently, there are two products on the list of items that are produced for stock: a chopping board and a knife holder. Both items require three operations: cutting, gluing, and finishing. The manager of the firm has collected the following data on these products: ------------------------------------------------------- Time per unit (minutes) Profit ---------------------------- Item per unit Cutting Gluing Finishing ------------------------------------------------------- Chopping board $ 4 1.4 5 12 Knife holder $ 6 1.8 13 3 ------------------------------------------------------- The manager has also determined that during each week 120 minutes are available for cutting, 650 minutes are available for gluing, and 360…arrow_forwardConsider the following set of one - dimensional data points: [3, 7, 11, 14, 18, 22]. Perform hierarchical clustering using the complete - linkage method. Provide a handwritten, detailed solution with all computationsarrow_forwardA manager believes that the introduction of a new model of keyboard for administrative staff will increase productivity. If productivity increases substantially, she will replace all the firm's current keyboards with the new models. To test this belief, she asked a sample of 12 administrative staff members to type a standard document on his/her old keyboard, and the number of words per minute were measured. After receiving the new keyboards and spending a few weeks becoming familiar with their operation, each employee then typed the same document using the new model of keyboard. Let Difference = New – Old. 1. This is an example of a: O a. One-sample z-test O b. One-sample t-test O c. One-sample proportion O d. Dependent samples t-test O e. Independent samples t-test 2. The test statistic value for this right-sided test is equal to 2.38. In which interval will the p-value of this hypothesis test fall? ) a. (0, 0.01) O b. (0.01, 0.05) OC. (0.05, 0.10) Od.(0.10, 1)arrow_forward
- Recent research suggests that the amount of time that parents spend talking about numbers can have a big effect on the mathematical development of their children (Levine, Suriyakham, Rowe, Huttenlocher, & Gunderson, 2010). In the study, the researchers visited the children's homes between the ages of 14 and 30 months and recorded the amount of “number talk" they heard from the children's parents. The researchers then tested the children's knowledge of the meaning of numbers at 46 months. The following data are similar to the results obtained in the study. Children's Knowledge-of-Numbers Scores for Two Groups of Parents Low Number-Talk High Number-Talk Parents Parents 2, 1, 2, 3, 4 3, 4, 5, 4, 5 3, 3, 2, 2, 1 5, 3, 4, 1, 2 4, 2, 3, 5, 4 5, 3, 4, 5, 4 Sketch a polygon showing the frequency distribution for children with low number-talk parents. In the same graph, sketch a polygon showing the scores for the children with high number-talk parents. (Use two different colors or use a solid…arrow_forwardSuppose a special type of small data processing firm is so specialized that some have difficulty making a profit in their first year of operation. what is the value of k?arrow_forwardA clinical psychologist is investigating whether the number of mistakes made by an employee can be forecast by the number of tasks an employee was busy with. She randomly assigned a different number of tasks (of the same level of complexity) to each of eight participants. After a participant completed all assigned tasks, the psychologist calculated the number of errors made. The data for all eight participants have been listed in the table below: Number of tasks performed simultaneously 2 4 7 6 2 5 1 3 Number of errors made 0 1 6 2 0 1 0 2 State which variable is the independent variable (?) and which is the dependent variable (?). Calculate Pearson’s correlation coefficient and interpret it.arrow_forward
- Recent research suggests that the amount of time that parents spend talking about numbers can have a big impact on the mathematical development of their children (Levine, Suriyakham, Rowe, Huttenlocher, & Gunderson, 2010). In the study, the researchers visited the children’s homes between the ages of 14 and 30 months and recorded the amount of “number talk” they heard from the children’s parents. The researchers then tested the children’s knowledge of the meaning of numbers at 46 months. The following data are similar to the results obtained in the study. Childrens Knowledge-of-Numbers Scores for Two Groups of Parents Low Number-Talk Parents 2, 1,2,3,4 3, 3, 2, 2, 1 5,3,4, 1,2 High Number-Talk Parents 3,4,5,4,5 4, 2,3,5,4 5, 3,4,5,4 Sketch a polygon showing the frequency distribution for children with low number-talk parents. In the same graph, sketch a polygon showing the scores for the children with high number-talk parents. (Use two different colors or use a solid line for one…arrow_forwardMany freeways have service (or logo) signs that give information on attractions, camping, lodging, food, and gas services prior to off-ramps. These signs typically do not provide information on distances. An article reported that in one investigation, six sites along interstate highways where service signs are posted were selected. For each site, crash data was obtained for a three-year period before distance information was added to the service signs and for a one-year period afterward. The number of crashes per year before and after the sign changes were as follows. Before: 14 29 62 123 64 62 After: 15 27 41 84 76 71 (a) The article included the statement "A paired t test was performed to determine whether there was any change in the mean number of crashes before and after the addition of distance information on the signs." Carry out such a test. [Note: The relevant normal probability plot shows a substantial linear pattern.] State and test the appropriate hypotheses. (Use a = 0.05.)…arrow_forwardAn aircraft emergency locator transmitter (ELT) is a device designed to transmit a signal in the case of a crash. The Altigauge Manufacturing Company makes 80% of the ELTS, the Bryant Company makes 15% of them, and the Chartair Company makes the other 5%. The ELTS made by Altigauge have a 4% rate of defects, the Bryant ELTS have a 6% rate of defects, and the Chartair ELTS have a 9% rate of defects (which helps to explain why Chartair has the lowest market share). i) If an ELT is randomly selected from the general population of all ELTS, find the probability that it was made by the Altigauge Manufacturing Company. If a randomly selected ELT is then tested and is found to be ii) defective, find the probability that it was made by the Altigauge Manufacturing Company.arrow_forward
 Mathematics For Machine TechnologyAdvanced MathISBN:9781337798310Author:Peterson, John.Publisher:Cengage Learning,