
Concept explainers
Videos
Cell phone handoff behavior. A "handoff' is a term used in wireless communications to describe the process of a cell phone moving from the coverage area of one base station to that of another. Each base station has multiple channels (called color codes} that allow it to communicate with the cell phone. The Journal of Engineering, Computing and Architecture (Vol. 3., 2009} published a study of cell phone handoff behavior. During a sample driving trip that involved crossing from one base station to another, the different color codes accessed by the cell phone were monitored and recorded. The table below shows the number of times each color code was accessed for two identical driving trips, each using a different cell phone model. (Note: The table is similar to the one published in the article.) Suppose you randomly select one point during the combined driving trips.
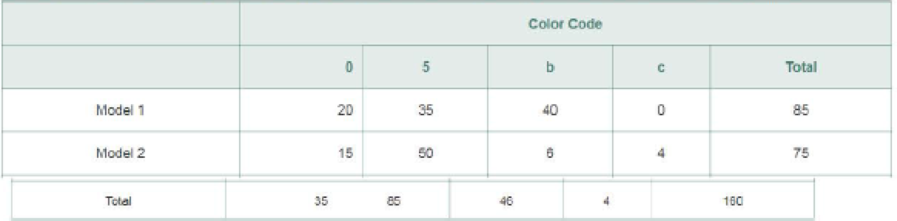
- a. What is the probability that the cell phone was using color code 5?
- b. What is the probability that the cell phone was using color code 5 or color code Q?
- c. What is the probability that the cell phone used was Model 2 and the color code was 0?
Want to see the full answer?
Check out a sample textbook solution
Chapter 3 Solutions
Statistics for Business and Economics (13th Edition)


- The director of the advertising section in a large newspaper is studying the relationship between the Community type in which a subscriber resides and the section of the newspaper he reads first. A sample of readers is collected and the results are shown below Section Read Community Type New Spor Com S ts ics Total City 171 100 89 360 2.30 0.59 1.22 Chi_sq 13 26 67 Suburb 121 111 99 331 2.68 1.30 0.48 Chi_sq 99 48 7 Rural 131 89 90 310 0.00 Chi_sq 39 Total 423 300 278 1001 the test statistic is 4.473 8.602 4.834 9.488 8.955arrow_forward4) Media Research Inc. conducted a study of the radio habits of urban and rural listeners. One facet of the study involved a participant’s listening time per day. a) State the Hypothesis to show the variation in the listening time depends on residence (urban or rural). b) Media Research Inc. collected the number of minutes spent listening to the radio in a day for a random sample of 10 urban and 11 rural listeners. The data appears below. Use JMP software to test the hypothesis of part a). c) Using aplha= 0.05, draw a conclusion for the hypothesis test and state the conclusion in the context of the problem. Residence Listening Time Urban 97 Urban 88 Urban 68 Urban 84 Urban 75 Urban 76 Urban 73 Urban 98 Urban 86 Urban 80 Rural 63 Rural 84 Rural 72 Rural 104 Rural 54 Rural 59 Rural 41 Rural 51 Rural 77 Rural 45 Rural 80arrow_forwardA cab was involved in a hit and run accident at night. There are two cab companies that operate in the city, a Blue Cab company, and a Green Cab company. It is known that 85% of the cabs in the city are Green and 15% are Blue. A witness at the scene identified the cab involved in the accident as a Blue Cab. This witness was tested under similar visibility conditions, and made correct color identifications in 80% of the trial instances. What is the probability that the cab involved in the accident was a Blue Cab rather than a Green one? Write your answer as a decimal with two representative digits, like 0.26 for example.arrow_forward
- he paper "From Dr. Kildare to Grey's Anatomy"† describes several studies of how the way in which doctors are portrayed on television might influence public perception of doctors. One study was described as follows. Rebecca Chory, Ph.D., now an associate professor of communication at West Virginia University, began studying the effect of such portrayals on patients' attitudes toward physicians. Using a survey of 300 undergraduate students, she compared perceptions of physicians in 1992—the end of the era when physicians were shown as all-knowing, wise father figures—with those in 1999, when shows such as ER and Chicago Hope (1994–2000) were continuing the transformation to showing the private side and lives of physicians, including vivid demonstrations of their weaknesses and insecurities. Dr. Chory found that, regardless of the respondents' personal experience with physicians, those who watched certain kinds of television had declining perceptions of physicians' composure and regard…arrow_forwardA doctor is concerned about the relationship between blood pressure and irregular heartbeats.Among her patients, she classifies blood pressures as high, normal, or low and heartbeats asregular or irregular and finds that:• 16% have high blood pressure;• 19% have low blood pressure; • 17% have an irregular heartbeat;• of those with an irregular heartbeat, 35% have high blood pressure; and• of those with normal blood pressure, 11% have an irregular heartbeat.What percentage of her patients have a regular heartbeat and low blood pressure?arrow_forward2.Researchers studied selenium levels in beef raised in a low selenium region of the United States. The goal of the study was to compare selenium levels in the region-raised beef to selenium levels in cooked venison, squirrel, and beef from other regions of the United States. The data in the Excel file (se_level.xlsx or se_level.txt) are the selenium levels calculated on a dry weight basis in mg=100 g for a sample of 53 region-raised cattle 11.23 29.63 20.42 10.12 39.91 32.66 38.38 36.21 16.39 27.44 17.29 56.20 28.94 20.11 25.35 21.77 31.62 32.63 30.31 46.16 56.61 24.47 29.39 40.71 18.52 27.80 19.49 15.82 27.74 22.35 34.78 35.09 32.60 37.03 27.00 44.20 13.09 33.03 9.69 32.45 37.38 34.91 27.99 22.36 22.68 26.52 46.01 38.04 30.88 30.04 25.91 18.54 25.51 Please answer the following questions: Use these data to construct: A…arrow_forward
- 2.Researchers studied selenium levels in beef raised in a low selenium region of the United States. The goal of the study was to compare selenium levels in the region-raised beef to selenium levels in cooked venison, squirrel, and beef from other regions of the United States. The data in the Excel file (se_level.xlsx or se_level.txt) are the selenium levels calculated on a dry weight basis in mg=100 g for a sample of 53 region-raised cattle 11.23 29.63 20.42 10.12 39.91 32.66 38.38 36.21 16.39 27.44 17.29 56.20 28.94 20.11 25.35 21.77 31.62 32.63 30.31 46.16 56.61 24.47 29.39 40.71 18.52 27.80 19.49 15.82 27.74 22.35 34.78 35.09 32.60 37.03 27.00 44.20 13.09 33.03 9.69 32.45 37.38 34.91 27.99 22.36 22.68 26.52 46.01 38.04 30.88 30.04 25.91 18.54 25.51 Please answer the following questions: Describe these data with…arrow_forwardThe data set provided in StatCrunch contains a random sample of 47 Craigslist posts for various used Honda Civics. A Mason student is interested in purchasing a used Honda Civic and wants to research what variables influence the price of the used cars: the age of the car or the mileage of the car. They recorded the “Price” in US dollars, the “Age” in years (counting from 2021, thus a 10-year-old car was a 2011 since 2021 – 2011 = 10), and the “Mileage” in thousands of miles. Use the “Mileage” in thousands of miles and “Age” in years to predict the “Price” in US dollars. The student wants to find which explanatory variable, either “Mileage” or “Age”, will be the best predictor of the response variable, “Price”. Investigate the relationship between the explanatory variables and response variable to help the student find the better predictor. -Interpret the scatterplot of “Age” and “Price” using trend, strength, and shape (form) and Interpret the scatterplot of “Mileage” and “Price” using…arrow_forwardWhich of the 3 central Tendency will help a teacher determine the tardiest student in class?arrow_forward
- A random sample of registered voters from Tampa, FL were asked if they support the DREAM Act, a proposed law which would provide a path to citizenship for people brought illegally to the US as children. The survey also collected information on the political ideology of the respondents. Based on the mosaic plot shown below, do views on the DREAM Act and political ideology appear to be independent? Views on the DREAM Act and political affiliation appear to be independent or dependent? Please, explain why?arrow_forwardSociologists argued that women on average earn less than men as women often choose to work less hours. They further suggest that the choice of hours worked may be driven by various factors such as age, childcare needs, occupation choice and flexibility. To investigate the relation between hours worked and income earned by Australian men and women, a researcher plans to survey a sample of individuals across the country. First, the researcher categorised the data into six location groups and six occupation groups, and calculated the frequencies given below. Frequency tables Location Occupation Location category Frequency Occupation category Frequency Location group A 5 Occupation group 1 4 Location group B 7 Occupation group 2 26 Location group C 12 Occupation group 3 15 Location group D 25 Occupation group 4 12 Location group E 10…arrow_forwardThe business objective of the director of planning of Game Ghana is to forecast monthly sales for all new stores, hased on the number of profiled customers who live no more than 30 minutes from a Game store. To examine the relationship between the number of profiled customers who live within a fixed radius from a Game store and its monthly sales, data were collected from a sample of 10 stores: Store 3 4 5 6 789 10 No. of Customers ('000) Monthly Sales ('000) ) Use the least-squares method to compute the regression coefficients a and b. 572 8 43 2453 812 6 14 879 10 12 8 (ii) Write down the estimated equation and predict the monthly sales if there are 9000 customers. (ii) Determine the coefficient of determination, r², and explain its meaning in this problem.arrow_forward
 Glencoe Algebra 1, Student Edition, 9780079039897...AlgebraISBN:9780079039897Author:CarterPublisher:McGraw Hill
 Calculus For The Life SciencesCalculusISBN:9780321964038Author:GREENWELL, Raymond N., RITCHEY, Nathan P., Lial, Margaret L.Publisher:Pearson Addison Wesley,
 Big Ideas Math A Bridge To Success Algebra 1: Stu...AlgebraISBN:9781680331141Author:HOUGHTON MIFFLIN HARCOURTPublisher:Houghton Mifflin Harcourt
 Holt Mcdougal Larson Pre-algebra: Student Edition...AlgebraISBN:9780547587776Author:HOLT MCDOUGALPublisher:HOLT MCDOUGAL