
Concept explainers
Videos
(a)
To explain: The reason of pie chart not being the correct to show the provided data.
(a)
Explanation of Solution
Given:
The data set is:
| Age | Bought music online(%) |
| 12 to 17 years | 24 |
| 18 to 24 years | 21 |
| 25 to 34 years | 20 |
| 35 to 44 years | 16 |
| 45 to 54 years | 10 |
| 55 to 64 years | 3 |
| 65 years and over | 1 |
A pie chart is type of graph that is drawn using the slices in order to represent the relative size of the provided data. To construct the pie chart, the sum of percentages must be equal to 100%.
Here, sum of percentage is:
Since, sum is not equal to 100%. Thus, pie chart is not appropriate in this case.
(b)
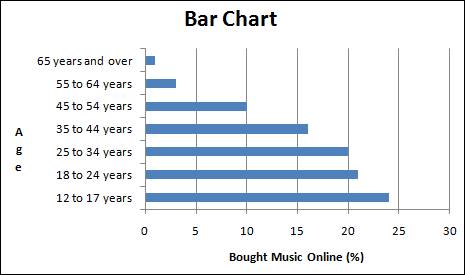
To construct: The bar graph for the provided data set and label the axes.
(b)
Explanation of Solution
The bar chart can be constructed as:
Chapter 1 Solutions
The Practice of Statistics for AP - 4th Edition
Additional Math Textbook Solutions
Elementary Statistics Using Excel (6th Edition)
Elementary Statistics (13th Edition)
Elementary Statistics: Picturing the World (7th Edition)
Statistics: The Art and Science of Learning from Data (4th Edition)
Introductory Statistics (2nd Edition)


 MATLAB: An Introduction with ApplicationsStatisticsISBN:9781119256830Author:Amos GilatPublisher:John Wiley & Sons Inc
 Probability and Statistics for Engineering and th...StatisticsISBN:9781305251809Author:Jay L. DevorePublisher:Cengage Learning
 Statistics for The Behavioral Sciences (MindTap C...StatisticsISBN:9781305504912Author:Frederick J Gravetter, Larry B. WallnauPublisher:Cengage Learning
 Elementary Statistics: Picturing the World (7th E...StatisticsISBN:9780134683416Author:Ron Larson, Betsy FarberPublisher:PEARSON
 The Basic Practice of StatisticsStatisticsISBN:9781319042578Author:David S. Moore, William I. Notz, Michael A. FlignerPublisher:W. H. Freeman
 Introduction to the Practice of StatisticsStatisticsISBN:9781319013387Author:David S. Moore, George P. McCabe, Bruce A. CraigPublisher:W. H. Freeman