
Concept explainers
Videos
(a)
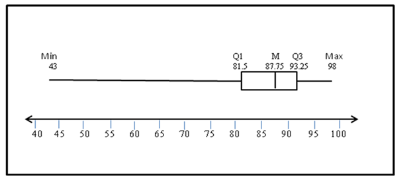
To make: a boxplot of the test score data.
(a)
Answer to Problem 92E
Explanation of Solution
Given:
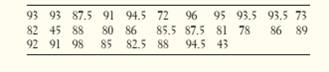
Calculation:
The box-plot for test score data of Mrs. Liao’s students on their first statistics test is below:

Now to check for outliers, we will calculate IQR and then we wil find out the upper and lower limits:
Any value above 110.875 and below 63.875 would be an outlier. In this case 43 and 45 are the outliers.
Conclusion:
“Thus, the box-plot is made for the given data”
(b)
To find: student’s performance on Mrs. L’s first test
(b)
Answer to Problem 92E
The students performed very well.
Explanation of Solution
Majority of students have done well in first statistics test. Only two out of thirty students were not able to score well. Since
Conclusion:
“Therefore, the students performed very well.”
Chapter 1 Solutions
The Practice of Statistics for AP - 4th Edition
Additional Math Textbook Solutions
Introductory Statistics
Elementary Statistics Using Excel (6th Edition)
STATS:DATA+MODELS-W/DVD
Essentials of Statistics, Books a la Carte Edition (5th Edition)
Intro Stats
Intro Stats, Books a la Carte Edition (5th Edition)


 MATLAB: An Introduction with ApplicationsStatisticsISBN:9781119256830Author:Amos GilatPublisher:John Wiley & Sons Inc
 Probability and Statistics for Engineering and th...StatisticsISBN:9781305251809Author:Jay L. DevorePublisher:Cengage Learning
 Statistics for The Behavioral Sciences (MindTap C...StatisticsISBN:9781305504912Author:Frederick J Gravetter, Larry B. WallnauPublisher:Cengage Learning
 Elementary Statistics: Picturing the World (7th E...StatisticsISBN:9780134683416Author:Ron Larson, Betsy FarberPublisher:PEARSON
 The Basic Practice of StatisticsStatisticsISBN:9781319042578Author:David S. Moore, William I. Notz, Michael A. FlignerPublisher:W. H. Freeman
 Introduction to the Practice of StatisticsStatisticsISBN:9781319013387Author:David S. Moore, George P. McCabe, Bruce A. CraigPublisher:W. H. Freeman