
Concept explainers
Videos
(a)
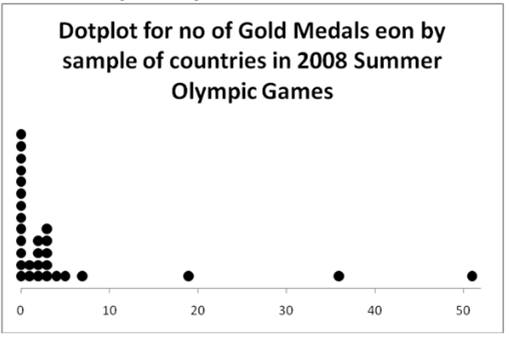
To make: a dotplot to display these data and describe the pattern of the distribution and deviations
(a)
Answer to Problem 38E
Shape: the data is right-skewed, because the highest dots are to the left of the dotplot.
Centre: it is about 0 gold medals, because the highest dots are at 0 in the dotplot.
Spread: it is from
Outliers: There are three outliers in the data; these are the values of China, Great Britain and the United States.
Explanation of Solution
Given:
| Country | Gold medals |
| Sri anka | |
| China | |
| Vietnam | |
| Great Britain | |
| Norway | |
| Romania | |
| Switzerland | |
| India | |
| Georgia | |
| Kyrgyzstan | |
| Costa Rica | |
| Brazil | |
| Uzbekistan | |
| Thailand | |
| Kuwait | |
| Bahamas | |
| Kenya | |
| Trinidad and Tobago | |
| Greece | |
| Mozambique | |
| Kazakhstan | |
| Denmark | |
| Latvia | |
| Czech Republic | |
| Hungary | |
| Sweden | |
| Uruguay | |
| United States |
Calculation:
Here we have the data of the total number of gold medals won by a randomly selected sample of countries as follows:
| Country | Gold Medals |
Dot Plot is one of the simplest graph that shows each data value as a dot above its location on number line. The dot plot for given data is below:
| Country | Gold medals |
| Sri anka | |
| China | |
| Vietnam | |
| Great Britain | |
| Norway | |
| Romania | |
| Switzerland | |
| India | |
| Georgia | |
| Kyrgyzstan | |
| Costa Rica | |
| Brazil | |
| Uzbekistan | |
| Thailand | |
| Kuwait | |
| Bahamas | |
| Kenya | |
| Trinidad and Tobago | |
| Greece | |
| Mozambique | |
| Kazakhstan | |
| Denmark | |
| Latvia | |
| Czech Republic | |
| Hungary | |
| Sweden | |
| Uruguay | |
| United States |
The overall pattern of the distribution can be described by its shape, center, spread and outliers.
Shape: The Dot plot has its peak at
Centre: We can describe centre by finding a value that divides the observations. So that about half take larger values and about half take smaller values. This is called Median of the distribution which is
Spread: The spread of the distribution tells us how much variability there is in the data. One way to describe the variability is to give the smallest and the largest values. The spread of given data is from
Outliers: The values that differ from the overall pattern and stand clearly apart from the rest of the distribution.
Mean
Conclusion:
Shape: the data is right-skewed, because the highest dots are to the left of the dotplot.
Centre: it is about 0 gold medals, because the highest dots are at 0 in the dotplot.
Spread: it is from
Outliers: There are three outliers in the data; these are the values of China, Great Britain and the United States.
(b)
To find: whether the sample of countries listed in the table is representative of this larger population or not
(b)
Answer to Problem 38E
The given sample does not represent the 2008 Summer Olympics.
Explanation of Solution
Calculation:
Here we have the data of the total number of gold medals won by a randomly selected sample of countries as follows:
| Country | Gold Medals |
Here we have informed that in the 2008 Summer Olympic,
In the given sample of
Therefore, the given sample does not represent the 2008 Summer Olympics.
Conclusion:
Therefore, the given sample does not represent the 2008 Summer Olympics.
Chapter 1 Solutions
The Practice of Statistics for AP - 4th Edition
Additional Math Textbook Solutions
Fundamentals of Statistics (5th Edition)
Intro Stats, Books a la Carte Edition (5th Edition)
Elementary Statistics (13th Edition)
Statistics for Business and Economics (13th Edition)
Statistics: The Art and Science of Learning from Data (4th Edition)


 MATLAB: An Introduction with ApplicationsStatisticsISBN:9781119256830Author:Amos GilatPublisher:John Wiley & Sons Inc
 Probability and Statistics for Engineering and th...StatisticsISBN:9781305251809Author:Jay L. DevorePublisher:Cengage Learning
 Statistics for The Behavioral Sciences (MindTap C...StatisticsISBN:9781305504912Author:Frederick J Gravetter, Larry B. WallnauPublisher:Cengage Learning
 Elementary Statistics: Picturing the World (7th E...StatisticsISBN:9780134683416Author:Ron Larson, Betsy FarberPublisher:PEARSON
 The Basic Practice of StatisticsStatisticsISBN:9781319042578Author:David S. Moore, William I. Notz, Michael A. FlignerPublisher:W. H. Freeman
 Introduction to the Practice of StatisticsStatisticsISBN:9781319013387Author:David S. Moore, George P. McCabe, Bruce A. CraigPublisher:W. H. Freeman